1
H.3.5Information Storage and RetrievalOnline Information Services J.4Computer ApplicationsSocial and Behavioral Sciences J.5Computer ApplicationsArts and Humanities[Performing arts] K.4.4Computers and SocietyElectronic Commerce
Economics, Human Factors
iTunes, MP3, Music, Peer-to-Peer, Stardom, Virtual Community, JEL-Classification: L82
Stardom is the situation, where a relatively small number of people (stars) earn enormous amounts of money and seem to dominate the field in which they are engaged. This phenomenon was first described by Marshall [27]. However, Marshall noted that stardom was not applicable to the music industry due to a lack of reproduction possibilities of live events. It was Rosen who first stated that this explanation was no longer valid as a result of the emergence of the record industry. The unlimited reproduction possibility of music made it possible for the music industry to become a stardom market [32,33].
Three forms of stardom can be distinguished in the music industry. The first, and the only one looked at in this paper, is similar to the definition by Rosen. This form describes the number of successful musicians within a genre. Initially Rosen did not limit his research to a specified genre. He analyzed stardom in a single market. But a genre can be described as a single market, because products within a genre are quite similar to one another whereas songs of different genres are rather heterogeneous when compared. This is why each genre can be seen as a differentiated market and success is measured as popularity within a genre. But this is not the only definition of success in the music industry. Other measurements include number one hits, as favored by Dowd [12], the number of songs in the top 10 and top 100 single and album charts, as favored by Lopes [25] and Peterson and Berger [30]. Chung and Cox on the other hand analyzed the number of gold records achieved by performers [7], while the volume of articles written about the artist in music magazines was a criterion used by Krueger [23], who also used the concert revenues market share as an indicator of stardom [23]. The second form of stardom is the popularity of different music genres [6], the third is the musical diversity of popular music [2,9,12].
Stardom leads to a limitation of available diversity and variety.
This can best be shown using Hotelling's model of minimum product differentiation [19].
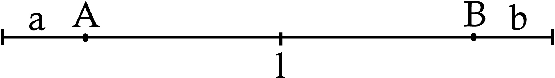
When Hotelling's model is transferred to the music industry, the listeners are considered to be distributed along a horizontal line, representing the horizontal differentiation of the different possible musical styles (within a genre).
In this application two artists ![]() and
and ![]() are located at distances
are located at distances ![]() and
and ![]() from the left and the right end of the horizontal line
from the left and the right end of the horizontal line ![]() respectively.
respectively.
The music market is a typical stardom market.
Only a limited number of artists are supplied by record companies and tour managers and demanded by the public.
A short empirical analysis can demonstrate this.
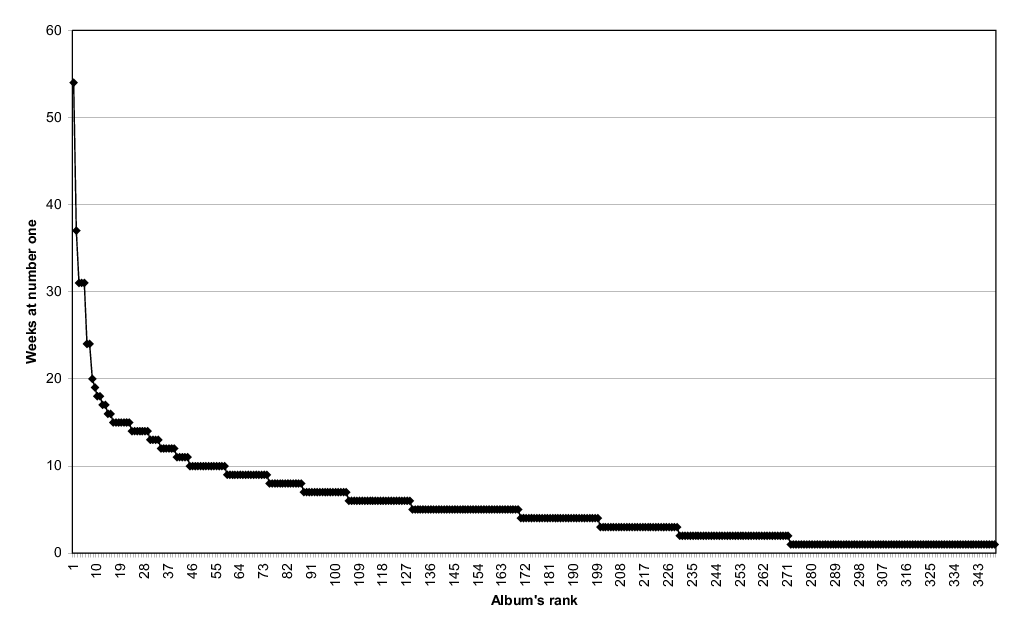
This approach aims to present the situation within the demand for records and musicians and defines success as the total of number one albums a particular musician has had.
By looking at the Billboard Charts and counting all number one albums in the period 1955-1990 in the USA we can see that even though 1,983 charts were published, only 349 albums made it to number one. The top 100 albums accounted for 62.6% of number one, 18.4% of top 10 and 7.1% of all top 40 albums.
Plotting those numbers leads to a convex curve (Figure 2), which can be described as followed:
The object of this research is firstly to identify the variables that initialize such a skewed distribution curve. The second step is to identify music distribution and presentation instruments that are able to flatten the skewed distribution curve in such a way that a larger diversity will be demanded by and available to the consumers. The research focuses on online music. Therefore empirical and analytical approaches are focused on consumers who use the internet on the one hand to be informed about music and upcoming events and on the other hand to download music files from the web. Essentially, the analyzed marketing instruments are online music distribution and presentation services such as peer-to-peer (P2P) file sharing networks, virtual communities (VC), and Apple's iTunes music store, but can also be applied to internet radio, music portals, etc.
Rosen explains that musicians with less talent are a poor substitute for more talented ones. Using modern technologies like records, radio, television and internet distribution, everybody can reach an unlimited audience size. Musicians with greater talent will thus always prevail over musicians with less talent [32]. Indeed, the technological advances are the key to explaining the music industry's demand function using Marshall's explanation [23]. But talent is difficult to measure. Most definitions used to measure talent include the ability to hear, recognize, and reproduce rhythm, technical ability, intonation and musical intelligence, and sensibility [13,26,35,37,38]. These variables are limited for several reasons: primarily due to their fuzziness and the necessity to perform individual tests on each person in order to measure their talent. This is probably the reason why talent is only rarely - and never in comprehensive detail - used to explain stardom empirically.
Another variable being difficult to measure empirically is the influence of social pressure on the demand for stars. Music is a hedonic consumption good, i.e. music is a good evoking emotion, but music also serves as an identifier [18,24,44]. Certain peer-groups exert pressure on people, forcing them to listen to some kind of music. Obvious examples are teenagers favoring stars up to having a crush on them or politicians and members of the `high society' having to attend certain opera festivals such as the Bayreuth festival in order to be accepted by their colleagues and peers. Such a behavior certainly leads to a demand for stars but is not comparable with original motivations for listening to music. At least this variable might be included in the variable 'communication possibility' which is being discussed below. From this point of view attendance of special events or favoring certain stars can be considered as the necessary common base for communication with others. But to measure peer group pressure as a variable on its own, people originating from the same peer group have to be analyzed and identified, as done by Johnstone and Katz, who analyzed music demand as a function of popularity and socio-economic background of teenage girls [20].1 This is not possible in an online survey addressed to online music consumers in general as no sociograms can be generated from such data. Moreover both talent and social pressure are variables not alterable by online music distribution and presentation services. This is why they have been excluded from my empirical analysis of the demand for stars.
Empirically measurable variables are those which can be identified and differentiated by the listener. In order to measure them, an online survey served as a tool to analyze online music consumers' reasons for listening to stars. Participants of the survey could evaluate different music download services. The importance of the factors describing the download services are used as dependent variables in a regression analysis explaining the demand for stars. On the one hand this allows the acceptance of different download offers to be assessed, but more importantly it reveals how young and not yet established musicians (nonstars) can be efficiently promoted via the internet.
The variables which are consulted are individual taste, knowledge and music capital, communication possibilities, reception costs, and music time. The new aspect here are not the variables themselves, but their combination and the empirical measurement the online distribution and presentation of music has, using those variables, on the demand for stars and for variety in the music industry.
Musical preference has been defined ``as a person's liking of the music at a particular moment with no long term commitment'' [24].
People who have a great incentive to listen to music that corresponds to their (temporal) exact taste in music will prefer a nonstar's music. As Rosen showed, the star's music corresponds to all listeners' median musical taste [34]. The chance that this is more or less exactly the actually preferred music is quite small.
The limited benefit arising through music consumption of less preferred music can also be shown with Hotelling's model, as demonstrated in section 1.
This variable is modeled by the completeness of the repertoire (![]() ) that is offered by an online music service, since only a completely available repertoire can ensure the distribution of every user's music preference.
) that is offered by an online music service, since only a completely available repertoire can ensure the distribution of every user's music preference.
The second variable is music capital. Music capital is knowledge about and experience of music. This variable is important because, firstly, listeners can only profit from a larger repertoire when they know what music is best for them to listen to. The higher the music capital is, the better the chance that the consumer can judge his/her mood and select the music that suits it best.
Second, music is an 'experience commodity', i.e. the more you know about music the more you can enjoy it [10,29,40,42,43].
Third, a rise in music capital leads to a diminution of risk when listening to new music [5,14].
Music capital can be gained by different approaches. Those include listening to music, learning about music and talking about music.
Music capital is a variable that initially guides the listener to a star's music, because the information market provides more information goods about stars than about nonstars.
As music capital rises, however, it may be assumed that demand for nonstars rises because of a broadened horizon as well.
This variable has been subject to different research in the field of music management. Especially interesting are those of Cameron and Collin [5], who treat a band's name as an asset reducing consumer's search costs deriving from risk aversion in an uncertain environment, and Lacher, who uses an individual's characteristics such as personality traits, affect intensity, and musical training and the resultant emotional, experiential, and analytical music responses in order to explain music preference as well as purchase habits [24].
The analysis presented in this paper includes music capital through the variable availability of actual or current information (![]() ) about music and artists.
) about music and artists.
The third variable of this model is communication possibilities. In principle this one is included in music capital, but its extreme importance suggests that it should be treated as a variable on its own.
It is accepted as being so important for several reasons. First, according to the results of the survey presented here, the music suggestions and opinions of friends and peers have an average importance of 69%.
In addition to its influence on music capital, the social phenomenon of discussing music is a factor of rising utility for each listener. Respondents agree that the desire to talk about music has an average importance of 67%.
Also prior to the empirical research presented here communication possibilities have been the subject of research. They are the variable of Adler's [1] and Crain and Tollison's [10] models explaining stardom in the music industry:
as stars have a higher installed fan basis, this variable originally results in an advantage of them because everybody patronizing a fan has more people to discuss music with.
Finally, the impact of importance of availability of communication possibilities by music consumers preferring nonstars' music proves (as indicated below) that the separation of communication possibilities from the music capital variable is useful to describe the internet's impact on music demand for nonstars.
The approach presented here measures communication possibilities via the importance of chats and discussion boards (![]() ) in online music services.
) in online music services.
The next variable is consumption capital. This is the portion of income that is reserved for music consumption uniquely. This variable has widely been discussed by Crain and Tollison [10].
Music performed by stars is more expensive than nonstars' music. The total volume of consumption capital being given, listeners have an incentive to listen to a nonstar's music because this allows them to maximize the amount of music listened to.
This research project tests the importance of consumption capital with the use of a binary variable (![]() ) distinguishing free and à la carte downloads for 99 cents per song.
) distinguishing free and à la carte downloads for 99 cents per song.
The last variable used to explain stardom in the music industry is music time, which is the time uniquely devoted to music. Music time is split up into the factors music listening (live and recorded) and search time. The latter is spent finding other fans to discuss music with, to find information about music and to find (recorded) music itself.
Since more information is available about stars and their music, and since stars have more fans than nonstars and finally because record stores (be it online or offline) tend to stock music by stars rather than nonstars, music time is a variable that allows stars to be in the lead.
This model already treats the availability of music (![]() ) and the installed fan base (
) and the installed fan base (![]() ). The third variable of time nature is a recommender system (
). The third variable of time nature is a recommender system (![]() ), allowing a reduced search time for music.
), allowing a reduced search time for music.
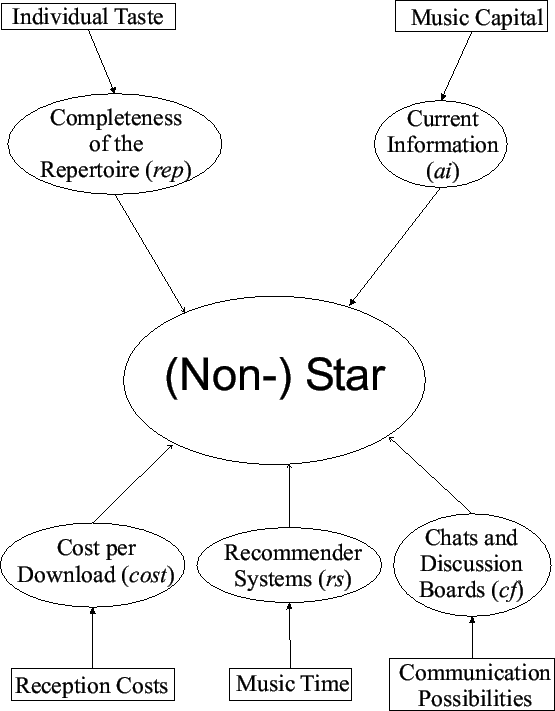
The factors set out here describing the demand for stars and nonstars and the variables modeling these factors are summarized in table 1.
A peer-to-peer network is a virtual network of users connecting their computers in order to share resources together [3,22]. The users are called peers. The shared resources can be of any nature and are commonly digitalized information products. Most P2P networks are file sharing networks and can exchange any digitalized product, but here we are only interested in music exchanging activities by individual consumers. P2P became popular with the launch of napster in 1999, many other P2P file sharing networks followed later. Due to the illegality of exchanging copyrighted music files decentralized P2P models have become established. These are networks not relying on a central server with a common database of available songs. Rather every peer can serve as a client and as a host. Upon entrance to the network every peer connects to a number of several other peers in a manner that a long chain of connected users emerges. When one of them searches for a certain song, the request is passed along the chain until a list of all available files is created. The user chooses the files to download and connects directly to the supplying peer. Two elements of this distribution model are especially interesting: The music is stored in a decentralized way, which means there is not one single place (no warehouse in the offline world, no server in the online world) where the music is located. The second interesting feature in this context is the fact that distribution is done by the consumers themselves. So the music producer is completely freed from the entire logistic chain. But at the same time he loses any control about the distribution of his product. This is exploited by many consumers who share their music with others without charging for it. Every connected user can download any provided song without having to pay. This again implies that the variable 'consumption capital' is affected in a way that the entirety of music distributed by P2P is free. The second variable affected by P2P is the completeness of the repertoire, a feature influencing the variable 'individual music taste'. Every connected user makes songs available to the network. The more users do so, the more songs are available and the smaller the gap becomes between all songs and available songs. Given a high enough number of users, this gap will only be of marginal size and the entire repertoire will be available without extra search time.
A virtual community (VC) is an internet-based community compound of active members having a joint focus of interest [4]. VCs are places where people not only meet virtually but where they also become instruments. They do so by accumulating and exchanging their knowledge, so that a VC can mutate to a living encyclopedia [16,31]. This adds positive effects to the variable 'music capital'. Apart from being a knowledge database a VC allows people, artists and managers of the music industry to communicate. A VC is the instrument allowing not only B2C, but also C2B and C2C communication. Artists can provide their music and users can discuss and recommend it. Usually VCs cover only one or a few music genres and connect less popular musicians. They distribute sample songs of their music for free, so that every user will be able to listen to them independently of his personal restrictions within the 'consumption capital' variable. Communication is made possible through chats and discussion boards leading to a discussion independent of time and space restrictions. Furthermore recommender systems can be integrated, permitting a reduction of search time for music, leaving more time left for music listening. Recommender systems may be content-based (e.g. using the VC editor's or musician's judgments and classifications) or collaborative-filtered (i.e. based on the musical taste of other members of the same VC) and are usually integrated through a search engine or a playlist [8,15,17,36,45]. Recommender systems are very interesting for the research of promotion possibilities of young and not yet established musicians as every user can use them as a very powerful and efficient tool to discover new and not yet known music.
The third distribution tool looked at in this paper is Apple's iTunes music store. It is the first successful legal and commercial distribution tool for online music. It was founded in 2003 and offers downloads of 1.8 million songs for 99 cents each. iTunes is both a distribution and presentation tool. It also offers up-to-date and background information about the distributed music and the artists for free. It also has an integrated collaborative filtering recommender system.
Using a conjoint analysis people are asked to judge their personal importance of the factors described in section 2. The results are used to describe their impact on the demand for stars and nonstars. This is done by regression analysis. This model is shown in figure 3.
Furthermore we can judge the potential acceptance of online music services such as P2P networks, VCs or the iTunes music store. The data is gathered by means of an online survey. More than 630 participants have been evaluated. As an incentive, participants could win 20 free songs at iTunes Music Store. To do so, they had to provide their email address, which was done by 53% of participants only. Therefore it can be assumed that the possibility of winning the songs was not a reason for taking part. Participants have an average age of 28, with a 25% quantile at the age of 21 and a 75% quantile at the age of 32. Female and male internet users are almost equally present (54% male). Respondents are distributed worldwide with a focus on the US (14%) and Germany (66%); almost half of the participants are enrolled at a university (41%).
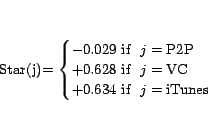
Formula 1 displays the aggregated results of the conjoint analysis.2
With ![]() being the probability of usage of an online music service
being the probability of usage of an online music service ![]() .
.
![]() is the index for P2P,
is the index for P2P, ![]() for VC,
for VC, ![]() for iTunes.
for iTunes.
![]() ,
, ![]() ,
, ![]() ,
, ![]() , and
, and ![]() are dummy variables and represent the availability of the above described features.
The variable
are dummy variables and represent the availability of the above described features.
The variable ![]() becomes
becomes ![]() when the download in the online service
when the download in the online service ![]() is free, otherwise it is
is free, otherwise it is ![]() .
The variable
.
The variable ![]() stands for the completeness of the repertoire within the online service
stands for the completeness of the repertoire within the online service ![]() , being 1 if the entire repertoire is downloadable, 0 if downloads are limited to songs having appeared in the present and past charts.
The other variables have the value
, being 1 if the entire repertoire is downloadable, 0 if downloads are limited to songs having appeared in the present and past charts.
The other variables have the value ![]() if the service is available, otherwise it is
if the service is available, otherwise it is ![]() .
All values of formula 1 describe the aggregated (for all online music consumers) relative utility of each feature.
.
All values of formula 1 describe the aggregated (for all online music consumers) relative utility of each feature.
We can see that two factors are essential to the probability of usage: the cost per download and the completeness of the repertoire. An online service providing the entire repertoire for free is most likely to be very successful. A P2P network is such a service offering free downloads of the entire repertoire. But it is not offering any information about the music and the artist; it has no integrated recommender system and no chat and discussion possibilities. A VC offers free downloads, offers recommender systems, current information about artists and the music, and members can communicate via chats and discussion boards. Finally iTunes does not offer free songs, nor the entire repertoire or communication possibilities. But it does offer recommender systems and well catalogued music files as well as current information.
We can calculate the probability of usage of each online music service by introducing the dummy variables into formula 1. The dummy variables are summarized in table 2.
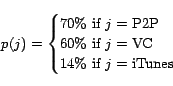
This model explains usage of online distribution services quite well. The correlation coefficients (Pearson) between the model's prediction and real usage of P2P file sharing networks, iTunes Music store and virtual communities are shown in table 3.
Those correlations are calculated as follows: The availability of the features analyzed with the conjoint analysis shows the relative importance of each feature for the usage of the online music distribution service. If the service offers this feature it is included in the calculation of usage probability, but it is excluded if it is not available. This leads to a degree of demand for each service. This degree is multiplied by each individual's music time, which is the entire time devoted to music. The resulting predicted time of usage is compared to real usage time. These correlations are summarized in table 3. They prove that this model can approximately predict real usage of online music distribution services. This is especially true for P2P file sharing networks and virtual communities.
Moreover, as can be seen, the model becomes more powerful the more it considers sophisticated users.
Another set of questions is aimed at defining the individual star-factor (![]() ) of each user. The star-factor is the degree of numbers of musicians listened to that are considered being stars (i.e. having appeared in the charts).
A high star-factor indicates that the user mainly listens to music performed by stars. Equally a negative star-factor signifies that the user prefers nonstars' to stars' music.
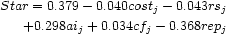
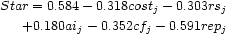
Using the results of the conjoint analysis as independent variables in order to describe the demand for stars and nonstars (a musician is considered to be either a star or a nonstar) we come to formula 2:
) of each user. The star-factor is the degree of numbers of musicians listened to that are considered being stars (i.e. having appeared in the charts).
A high star-factor indicates that the user mainly listens to music performed by stars. Equally a negative star-factor signifies that the user prefers nonstars' to stars' music.
Using the results of the conjoint analysis as independent variables in order to describe the demand for stars and nonstars (a musician is considered to be either a star or a nonstar) we come to formula 2:
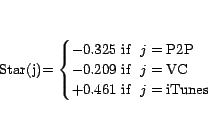
The change of significant variables explaining the demand for stars and nonstars as online music consumption rises is summarized in table 4. This table shows only significant variables. Each column describes people downloading at least a certain amount of MP3s per month.
Seen globally, formula 2 and 4 show that while iTunes appears to be a tool to distribute popular music especially, P2P networks are a tool to promote less popular music. VCs promote stars' and nonstars' music equally. Therefore P2P file sharing networks are the online music distribution tool allowing young and not yet established musicians to be heard by a wider audience. Consumers can download unknown music without the risk of diminishing their disposable consumption capital. This will add to recipients' music capital and eventually lead consumers to go to concerts they would not have gone to without knowing the music. Since the main income source for most musicians is from performances and not recorded music [28], P2P networks will help to generate an income for nonstars, allowing them to further perform and establish a greater diversity of music.
But what are the factors explaining this demand? The results of the conjoint analysis show that although consumption capital is important for the acceptance of an online music service it can only explain demand for stars and nonstars if downloaders, especially heavy downloaders, are looked at. Only then can we see that consumption capital is a factor favoring a nonstar's music. Therefore a listener's behavior concerning this variable as indicated in section 2 can be confirmed for people involved in music downloading.
No impact on the demand for either stars or nonstars is achieved by providing recommender systems.
Information about actual and current activities and events is a feature primarily demanded by music listeners who prefer stars' music - at least when the entire sample is being analyzed. This shows that the in section 2 predicted behavior is true when all users but heavy downloaders are looked at. The importance of current information for listeners of popular music leads to the interpretation that consumers preferring stars' music tend to appreciate short term information in order to have access to the artists themselves than consumers preferring nonstars' music do. This information includes announcements of concerts, new releases, etc. This differing demand could be explained by the fact that stars usually publish more records and tour more often than nonstars. Therefore current information about stars is in greater demand by consumers than current information about nonstars.
The features which are also able to promote a more diverse music market are discussion possibilities and completeness of the repertoire. Those become even more important when looking at intensive downloaders only. The last factor is not surprising, as this is according to Rosen's and Hotelling's models nonstars' music in principle. At first sight the fact that discussion possibilities are more important for nonstars' fans than for stars' fans seems surprising, as it has been identified by Adler and Crain and Tollison as a variable favoring a star's music. But the importance to nonstar listeners proves that Adler's and Crain and Tollison's initial interpretations are right, because communication possibilities are very important to music consumers and stars have a larger installed fan base. But the internet is a very efficient tool allowing people listening to all kinds of music to communicate together. Using internet marketing tools every niche can aggregate enough listeners to be able to allow a conversation. Every topic can be discussed and people listening to unpopular music can finally find other fans listening to the same music, enabling them to share thoughts and opinions with others [11,21,41]. This seems to be the reason why people involved in online music and preferring nonstars' music value communication possibilities such as chats and discussion boards so much.
Finally it should be noted that completeness of the repertoire (![]() ) and cost per download (
) and cost per download (![]() ) are the very variables that initiate the demand for online music services and also are capable of explaining (together with discussion possibilities) demand for nonstars' music.
This implies that it should be expected that as demand for online music services rises, demand for less popular music and less popular musicians will rise as well.
) are the very variables that initiate the demand for online music services and also are capable of explaining (together with discussion possibilities) demand for nonstars' music.
This implies that it should be expected that as demand for online music services rises, demand for less popular music and less popular musicians will rise as well.
The results can further be used to give an answer to the music industry discussion whether online music services such as P2P lead to a decline of record sales. Looking at the German music industry a segment of intensive consumers can be identified [39]. They are defined by their consumption habits: they buy more than nine CDs a year. This group consists of 3.7% of the population and is responsible for 38% of all sales. This is the target audience of the record industry. Other segments are average consumers, who buy less then nine, but at least 4 CDs a year, extensive consumers, which are people buying less then 4 CDs a year and non-consumers, who do not buy any CDs.
We can define people's relative consumption of MP3s3
and CDs by dividing the number of downloaded MP3s by 13 times the number of bought CDs: ![]() .4
Within the group of intensive consumers this calculation leads to an average ratio of 0.75 which means that intensive consumers buy more songs on CDs as they download,
as compared to an average
.4
Within the group of intensive consumers this calculation leads to an average ratio of 0.75 which means that intensive consumers buy more songs on CDs as they download,
as compared to an average ![]() -ratio of 3.5 for average and 5.6 for extensive consumers (i.e. they download respectively 3.5 and 5.6 as many songs as they buy on CD).
This shows that people buying many CDs still prefer this medium to MP3s.
Moreover the number of downloaded songs within the segment of intensive consumers is a highly skewed distribution function. Almost one fourth of intensive consumers do not listen to music in MP3s format.5
Another 21% do listen to MP3s but do not download them from the internet.
14% download on average more than one song per day, only 3% download three or more songs on a daily basis.
Looking at the ratio of
-ratio of 3.5 for average and 5.6 for extensive consumers (i.e. they download respectively 3.5 and 5.6 as many songs as they buy on CD).
This shows that people buying many CDs still prefer this medium to MP3s.
Moreover the number of downloaded songs within the segment of intensive consumers is a highly skewed distribution function. Almost one fourth of intensive consumers do not listen to music in MP3s format.5
Another 21% do listen to MP3s but do not download them from the internet.
14% download on average more than one song per day, only 3% download three or more songs on a daily basis.
Looking at the ratio of ![]() we have a mean of 75% but a 75% quantile of 38% and a 95% quantile of 3 times as many MP3s downloaded than songs bought on CD.
This skewed distribution of downloading and buying habits shows that there is only a small fraction of heavy downloaders within the main target group of the record industry. So only a small fraction can be assumed to threaten the established business model of the recording industry by the use of online music services.
we have a mean of 75% but a 75% quantile of 38% and a 95% quantile of 3 times as many MP3s downloaded than songs bought on CD.
This skewed distribution of downloading and buying habits shows that there is only a small fraction of heavy downloaders within the main target group of the record industry. So only a small fraction can be assumed to threaten the established business model of the recording industry by the use of online music services.
The ratio ![]() is positively correlated to the usage of P2P file sharing networks. It has a Pearson's correlation coefficient of 0.408 at a significance level of
is positively correlated to the usage of P2P file sharing networks. It has a Pearson's correlation coefficient of 0.408 at a significance level of ![]() .
The other online distribution services, including iTunes Music Store and virtual communities, have no significant correlation with this ratio.
This indicates that the sources of MP3s are P2P file sharing networks.
.
The other online distribution services, including iTunes Music Store and virtual communities, have no significant correlation with this ratio.
This indicates that the sources of MP3s are P2P file sharing networks.
Another interesting result appearing while comparing demand for music with demand for stars is that the numbers of bought CDs and the number of downloaded songs both have a small negative correlation with the star-factor. One can conclude that more intense music consumption leads to a preference for nonstars. This can be seen as evidence for the statement made above that music capital and hence knowledge about music, both accruing mainly because of intensive music consumption, are indeed factors favoring the demand for nonstars' music and therefore a more diverse music market.