
|
|
Zakaria Maamar |
Boualem Benatallah School of Computer Science & Engineering The University of New South Wales Sydney NSW 2052, Australia boualem@cse.unsw.edu.au |
Wathiq Mansoor College of Information Systems Zayed University P.O. Box 19282, Dubai, U.A.E wathiq.mansoor@zu.ac.ae |
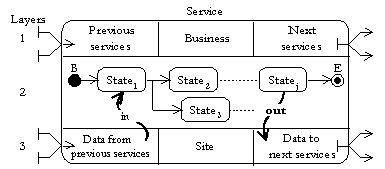
H.4.5Information Systemsservice-oriented applications. Modeling, Diagrams. state, service, diagram, conversation.
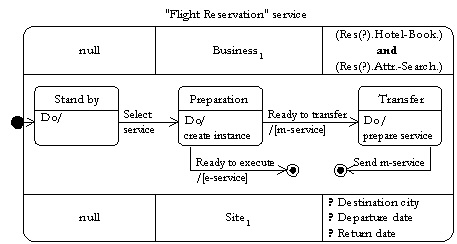
| Field | Value |
| Previous services | null |
| Next services | (Reservation(?).Hotel Booking) and (Reservation(?).Attraction Searching) |
| Business | Business |
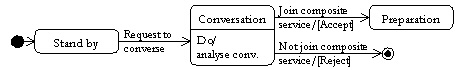
| States | Stand by, Preparation, /Transfer |
| Data from previous services | null |
| Data for next services | ?Destination_city, ?Departure_date,?Return_date |
| Site | Site |
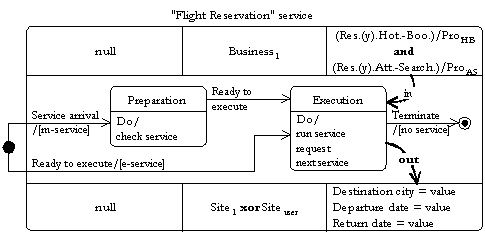
| Field | Value |
| Previous services | null |
| Next services | (Res.(y).Hotel Booking)/Pro. and (Res.(y).Attraction Searching)/Pro. |
| Business | Business |
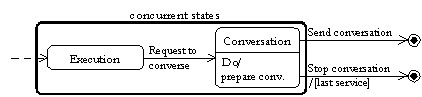
| States | /Preparation, Execution |
| Data from previous services | null |
| Data for next services | Value(Des._city,Dep._date,Ret._date) |
| Place | Site |
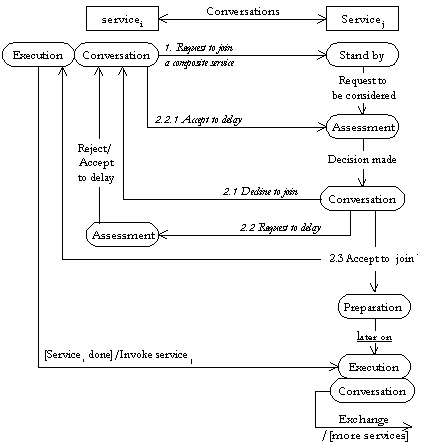
| Identifier: conversation |
| In-reply-to: null |
| From: Service |
| To: Service |
| Content: |
| Subject: request-to-join-composite-service |
| Deadline-to-respond: time & date |
| |
| / |