


Journal reference: Computer Networks and ISDN Systems, Volume 28, issues 7–11, p. 1539.
Enrico Gobbetti (1) and Andrea O. Leone (2)
(1) UMBC, CSEE Dept., Baltimore, USA - CESDIS , NASA GSFC, Greenbelt, USA
(2) Centre for Advanced Studies, CRS4, Research and Development in Sardinia, Cagliari, ITALY
E-mail: gobbetti@cs.umbc.edu, cirio@crs4.it
The Virtual Sardinia project aims at collecting a large amount of heterogeneous data concerning the island of Sardinia and representing them in such a way that a casual user can easily navigate through them in a virtual trip. All these data are interconnected in an hypermedia way, browsable in the World-wide Web, ranging from geographic to archaeological data, from historical to touristical information, both in 2D and 3D. One of the central components of Virtual Sardinia is i3D, a high-speed 3D scene viewer for the World-wide Web. Using a Spaceball, the user can intuitively navigate with continuous viewpoint control inside three-dimensional data, while selecting 3D objects with the mouse triggers requests for access to remote media documents that can be distributed over the Internet. This allows to explore interactively a three-dimensional reconstruction of the island of Sardinia built from a digital terrain model texture-mapped with satellite images. Alternate interactive views of the model are provided in the form of movies, sequences, or clickable maps. The combination of these models becomes a natural front-end for querying all kinds of scientific, cultural, and touristic information about Sardinia. We believe that this approach opens a new way to create regional information systems easily available that could be made available to the general public.
The Virtual Sardinia project builds on these recent advances. Its goal is to collect a large amount of heterogeneous data concerning the island of Sardinia and representing them in such a way that a casual user can easily navigate through these data in a virtual trip (see Figure 1). The front end for accessing these data is a detailed 3D reconstruction of the island of Sardinia that can be explored in real-time. All the related data are interconnected in an hypermedia way, browsable in the WWW, ranging from geographic to archaeological data, from historical to touristical info, both in 2D and 3D. Thanks to this project, Sardinia becomes a wonderful place to visit also in the intangible Web information universe.
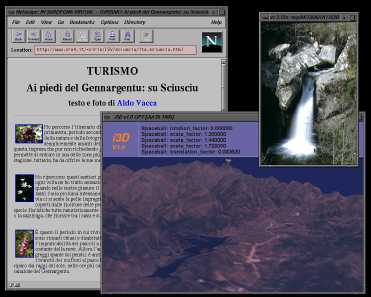
Figure 1. Sight-seeing in Virtual Sardinia
In this paper we provide an overview of the Virtual Sardinia project. All the features described here can be accessed at the address http://www.crs4.it/PRJ/VIRTSARD/.
To provide users with the ability of interactively exploring a 3D model of the island of Sardinia, we have developed a system that allows to transform the elevation data and satellite images used in traditional cartography into a multiresolution VRML model that can be viewed on a graphics workstation. To make possible exploration at interactive speeds of very large models, we have developed a special high-speed 3D Web browser that incorporates sophisticated time-critical rendering techniques.
Several steps have to be performed to obtain a 3D model of the Sardinia island. A first step involves the registration of the data with respect to a geographical system, taking into account the satellite viewing direction and the earth sphericity. A second step has to be performed to normalize values coming from different areas in order to have the same distribution on each corresponding bands. This problem arises because of different meteorological conditions during satellite image captures. Another step of the process involves the merging of different areas to obtain a single image. In our case we merged four different satellite images to cover the whole Sardinia island. The final step is the composition of images corresponding to different wave lengths to obtain the desired image. In our case we selected the blue, green and red wave length to have a realistic representation of the Sardinia, like a color picture taken from the space. The last operation is the color enhancement of the resulting image to correct unwanted deviation from visually realistic colors, mainly due to athmospheric effects.
The complexity of the terrain model represented as a regular grid is far too high to allow an interactive exploration even on high-end workstations. To be able to obtain interactive speeds during the terrain visualization, we have to optimize the model so as to allow the renderer to trade rendering quality with speed. All the optimizations are performed automatically by a software tool that we created that takes as input elevation data, satellite image, and desired quality parameters for the output. The original terrain data (a single 359x681 regular grid containing the elevation data each 400 m) is subdivided in 16x10 quadrants (that can then be culled independently). Each of the 160 quadrants is then represented at 3 levels of detail by producing, from the original regular sub-grid, a series of irregular triangular meshes with a decimation algorithm that iteratively removes vertices from planar regions of the mesh [7]. At the same time, images are scaled to fit into texture memory. Different planarity tolerances, adaptively adjusted during decimation, are used to obtain the desired 3 levels of details. Cracks between adjacent quadrants are avoided by using fixed low tolerances at the borders. The appropriate level of detail for each of the quadrants can then be chosen by the renderer at run time. Currently, the maximum complexity of the model after optimization is of 108617 triangles, while the minimum model complexity is of 41987 triangles.
To allow users to view high-resolution versions of a region, we add hyperlinks from each of the quadrants to a high-resolution version of the region surrounding it, so that the interactive selection of a quadrant will trigger the loading and display of its high-resolution version. Since the high-resolution regions are smaller that the entire model and have access to the same hardware resources of the entire model when renderer (rendering speed, texture memory), more details can be included. These high-resolution versions are constructed automatically by our software tool by recursively applying to regions surrounding each quadrant the same algorithm we apply to the entire model.
Visual annotations (see Figure 2) on the 3D model are placed at interesting sites under the form of 3D objects with an associated URL. The interactive selection of one of these markers during navigation will be translated by the browser in a request to fetch and view the associated descriptive document, that can be in the form of text, still images, animations or even other 3D models.
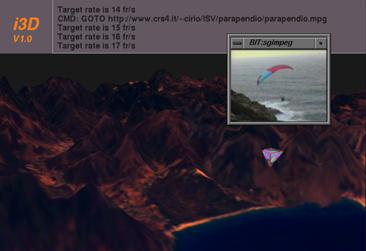
Figure 2. Annotations
i3D's device configuration uses a Spaceball and a mouse as input devices. The Spaceball is used for the continuous specification of the camera's position and orientation using an eye-in-hand metaphor [8], while the mouse is used to select objects and access media documents. Both user's hands can therefore be employed simultaneously to input information. Keyboard commands are used to control various visibility flags and rendering modes. The ability to continuously specify complex camera motions in an intuitive way together with high visual feedback rates provides an accurate simulation of motion parallax, one of the most important depth cues when dealing with large environments [3][4].
During navigation, the i3D's time-critical rendering engine is activated at regular intervals by the main i3D event loop and is requested to refresh the screen while adhering to the user-specified timing constraint. At each activation, the rendering engine renders a single frame by executing a well defined sequence of operations.
First, the database is traversed and the objects visible from the observer's viewpoint are identified by hierarchically determining the visibility of portions of the scene through a traversal of an octree spatial subdivision. Each of the objects identified is then compiled into a graphical description by stripping off its appearance attributes and compiling them into a device-dependent sequence of drawing commands. During this conversion, geometries are optimized to reduce their rendering time; in particular, structured triangular meshes are generated from the triangle lists stored in the database. To avoid recreating compiled versions at each frame, as it is done in systems like Performer [6], the graphical descriptions generated for each database object are cached and reused while still valid.
To control the number of polygons rendered at each frame, so as to be able to meet the timing requirements, the time-critical rendering engine traverses the generated display list and selects the level of detail at which each of the objects will be represented. Level of detail selection is based on the importance of each object for the current frame, which is determined by computing an approximation of its size projected on the screen, and on feedback regarding the time required to render previous frames. The feedback algorithm is similar to the one used by Performer [6]. Update rates are associated to the different objects in the database to avoid recomputing their projection on the screen and their compiled versions at each frame.
Once the levels of details are selected, the display list is sorted to maximize rendering state coherence and rendered by executing each of the compiled command sequences for the selected level of detail of each of the objects. Rendering statistics for the current frame are updated and stored so as to be used when selecting the level of detail selection for the next frame.
Thanks to these rendering optimizations and to the preprocessing done on the data, the textured 3D model of the Sardinia island can be interactively explored at more than 10 frames/second on a Silicon Graphics Onyx RE2.
In the context of the Virtual Sardinia project we use Web-live to offer users the possibility to select and view video-tapes showing aspects of the island. For example, video-tapes showing life scenes of a particular region can be viewed by selecting particular markers on the terrain during 3D navigation. Another important usage of Web-live is to allow users that do not have graphics workstation to view pre-recorded flights over the 3D-model. In this case, Web-live is used to distribute over the network 30 minutes of live-video taken during a navigation within the model and while interacting with it, showing the capabilities of the browser, the model itself and informations hyperlinked to it, bringing the remote visitor into a virtual visit of Sardinia.
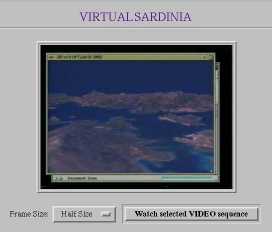
Figure 3. Virtual Sardinia explored through Web Live
The basic technique used with Web Live is the Server Push feature introduced by Netscape Communications, with release 1.1 of their WWW Netscape Navigator browser (also available in other browsers, for instance the VOLBrowser of Video On Line).
With this mechanism the server sends down a chunk of data. The browser display them leaving the connection open to receive more data for a fixed time or until the client interrupts the connection.
The MIME type used for the server push is called
"multipart/x-mixed-replace". The "replace" indicates that each new
data block will cause the previous data block to be replaced -- that
is, new data will be displayed instead of (not in addition to) old
data. A simple description of a CGI program that uses this technique is
described below.
print "Content-type: multipart/x-mixed-replace;boundary=---ThisRandomString---"
print "---ThisRandomString---"

while true {

  print "Content-type: image/jpg"

  print <image>

  print "---ThisRandomString---"

}
Figure 4. Web live functionality map
Web Live performs real-time image grabbing from an analog or digital video source (camera, VCR, TV tuner, Laser Disc, ...). The remote user interacts with Web Live trough a CGI program that acts as a client interface (Figure 4). The user can select frame size, image quality and frame rate of the sequence of images and then watch the real-time grabbed video frames. The Web-live approach offers two main advantages with respect to the distribution of precomputed movies: first, since frames are displayed by the client as soon as they arrive, the latency is drastically reduced at the beginning of the movie; second, since viewing parameters are determined by the client, the user can configure them to perfectly fit her needs, and does not depend on choices made at the server side as with precomputed movies.
Starting from a movie, a number of frames are grabbed at the desired rate and stored on disk at half video size in compressed format, with timing informations coded in the file name. From them, quarter-size and eighth-size video frames are also computed. Once an entire sequence is acquired, the system is able to show to the user the entire grabbed movie in a single view, by putting eight-sized frames in a parametric NxM table from first to last image with the appropriate time step to fill the table. From here the user can easily browse the movie. Allowed operation are:
In the Virtual Sardinia context, Web Show has been used to allow the browsing of the previously mentioned 30 minutes tape, from which we extracted 1389 frames, at the approssimate rate of 0.5 frame per second.
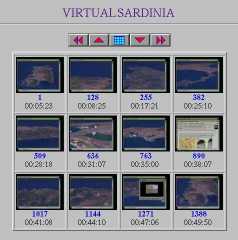
Figure 5. Virtual Sardinia explored through Web Show
This is another way to view remotely the precomputed exploration of the model, with the advantage that the user can easily identify sequences of the video with its corresponding geographical location. In combination with the interactive 3D navigation, this facility can also be used to preview have a guided tour of a certain area before interactively exploring it.
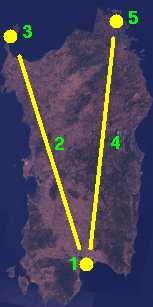
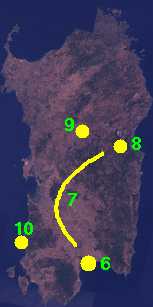
Figure 6. Clickable maps
From a geographic point of view, a scientist can use the model to examine different maps of Sardinia in a 3D environment, retrieving cartographic information directly tight to the elevation of the terrain. With our model it is now possible to analyze three-dimensional variations, both for territorial planning and structural geology analysis. The combined vision of the satellite images and the spatial model leeds to a new frontier in territorial variation interpretation.
Multiple ways to explore the Sardinia territory are used to provide different views and navigation tools. A large amount of heterogeneous data concerning the island of Sardinia is represented in such a way that a casual user can easily navigate through them in a virtual trip. All these data are interconnected in an hypermedia way, browsable in the World-wide Web. We believe that this approach provides a new way to create regional information systems easily available that could be made available to the general public.
Future directions of the project will be toward: a finer resolution of the 3D model, both for images and for elevation data; the addition of new hyperlinks to the 3D model; the creation of "specialized" thematic models, e.g. a model only with touristical informations, another one with geological data, and so on; different combinations of the satellite images to explore different aspect of the island, e.g. vegetation and water distribution.
The Virtual Sardinia project can be accessed at the address http://www.crs4.it/PRJ/VIRTSARD/. All the features described in this paper are currently available to the general public, except for the 3D interactive navigation, which is for the moment limited to users at our site.
Research and development described in this paper have been carried out with the financial contribution of Sardinia Regional Authorities.
[1] J.-F. Balaguer and E. Gobbetti: i3D: A High-Speed 3D Web Browser. Proc. ACM Symposium on VRML (1995).
[2] T. J. Berners-Lee, R. Cailliau, J.-F. Groff, and B. Pollermann: World-Wide Web: The Information Universe. Electronic Networking: Research, Applications, and Policy 2(1) (1992): 52--58.
[3] F. P. Brooks Jr and P. Frederick: Walkthrough - A Dynamic Graphics System for Simulating Virtual Buildings, Proc. ACM SIGGRAPH Workshop on Interactive 3D Graphics (1986): 9--22.
[4] T. A. Funkhouser and C. H. Sequin, Adaptive Display Algorithms for Interactive Frame Rates During Visualization of Complex Virtual Environments. Proc. ACM SIGGRAPH (1994): 247--254.
[4] S. Ghee and J. Naughton-Green, Programming Virtual Worlds. ACM SIGGRAPH Tutorial Notes on Programming Virtual Worlds (1994): 6.1--6.58.
[5]
A. Parisi, M. Pesce:
Virtual Reality Markup Language (VRML),
URL: http://www.wired.com/vrml/ (1994).
[6] J. Rohlf and J. Helman: Performer: A High Performance Multiprocessing Toolkit for Real-Time 3D Graphics. Proc. SIGGRAPH (1994): 381--395.
[7] Schroeder WJ, Zarge JA, Lorensen WE: Decimation of Triangle Meshes. Proc. SIGGRAPH (1992).
[8] C. Ware, and B. Osborne, Exploration and Virtual Camera Control in Virtual Three Dimensional Environments, Proc. ACM SIGGRAPH Workshop on Interactive 3D Graphics (1990): 175-183.
[9]
Webspace... because the World is not Flat!
URL: http://www.webspace.com/
[10] WebOOGL: Integrating 3D graphics and the Web. http://www.geom.umn.edu/software/weboogl/
[11]
SDSC WebView - A VRML Internet Browser.
URL: http://www.sdsc.edu/EnablingTech/Visualization/vrml/webview.html
Andrea O. Leone
is a Researcher in the Scientific Visualization
and Digital Media Group of CRS4, Centre for Advanced Studies,
Research and Development in Sardinia, located in Cagliari –
Italy. His current research interests include image processing,
computer animation and data formats. At CRS4 he is currently in
charge to maintain the VideoLab and to support CRS4 researchers
for scientific visualization and animation.
http://www.crs4.it/~cirio/