The question of measuring correlations in the Web data has led to many controversial results. Most notably, there is no agreement in the literature on the dependence between in-degree and PageRank of a Web page [4], [5]. One of the main points that we make in this work is that the commonly used correlation coefficient is an uninformative dependence measure in heavy-tailed data [3], [7] typical for the Web and Wikipedia graphs.
A natural mathematical formalism for analyzing power laws is
provided by the theory of regular variation. By definition, the
distribution ![]() has a regularly
varying tail with index
has a regularly
varying tail with index ![]() , if
, if
![]() where
where
![]() is a slowly varying
function, that is, for
is a slowly varying
function, that is, for ![]() ,
,
![]() as
as
![]() . Below we
analyze the dependence structure in the power law data by means
of contemporary statistical techniques specially designed for
multivariate regular variation [7].
. Below we
analyze the dependence structure in the power law data by means
of contemporary statistical techniques specially designed for
multivariate regular variation [7].
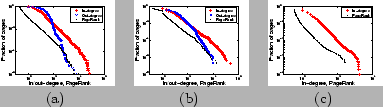
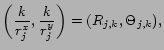
Figure 1: Cumulative log-log plots for in/(out)-degree and PageRank: (a) EU-2005, (b)Wikipedia, (c) Growing Network
The log-log plots for in-degree and PageRank in Figure 1 resemble the signature straight line indicating power laws. However, several techniques should be combined in order to establish the presence of heavy tails and to evaluate the power law exponent. Using QQ plots, Hill and altHill plots as well as Pickands plots [7] we confirm that the in-degree and PageRank follow power laws with similar exponents for all three data sets. We also conclude that the out-degree can be modeled reasonably well as a power law with exponent around 2.5-3, see [8] for details.
Although all plots in Figure 1 look alike, it does not imply that the three networks have identical structure. The main goal of the present work is to rigorously examine the dependencies between the network parameters.
Now we need to consider the points
![]() and make a plot for
cumulative distribution function of
and make a plot for
cumulative distribution function of ![]() . In other words, we are interested in the
angular measure, i.e. in the empirical distribution of
. In other words, we are interested in the
angular measure, i.e. in the empirical distribution of
![]() for
for ![]() largest values of
largest values of
![]() . Thus, unlike the
correlation coefficient, the angular measure provides a subtle
characterization of the dependencies in the tails of X and Y, or,
extremal dependencies. If such measure is concentrated
around
. Thus, unlike the
correlation coefficient, the angular measure provides a subtle
characterization of the dependencies in the tails of X and Y, or,
extremal dependencies. If such measure is concentrated
around ![]() then we observe a
tendency toward complete dependence, when a large value of
then we observe a
tendency toward complete dependence, when a large value of
![]() appears simultaneously
with a large value of
appears simultaneously
with a large value of ![]() . In the
opposite case, when such large values almost never appear
together, we have either large value of
. In the
opposite case, when such large values almost never appear
together, we have either large value of ![]() or large value of
or large value of ![]() , hence,
, hence, ![]() should be around 0 or
should be around 0 or ![]() The
middle case plots can be seen as a tendency to dependency or
independency.
The
middle case plots can be seen as a tendency to dependency or
independency.
In the case of bi-variate data, a suitable value of
![]() can be determined by
making a Starica plot [7]. We consider radii
can be determined by
making a Starica plot [7]. We consider radii
![]() from (1) and write
from (1) and write ![]() for the
for the
![]() th largest value. To get
Starica plot we graph
th largest value. To get
Starica plot we graph
Figure 2: (a) Starica plot for in-degree and PageRank for EU-2005 data set; Cumulative functions for Angular Measures: (b) in-degree and PageRank; (c) in- and out-degrees; (d) out-degree and PageRank
The results are striking. For the Wikipedia data set we
observe the independence of the tails of in-degree and PageRank.
That is, an extremely high in-degree almost never implies an
extremely high ranking. The picture is completely opposite for
Growing Networks, where the angular measure is indicating a
complete dependence. Thus, in highly centralized preferential
attachment graphs, most connected nodes are also most highly
ranked. Finally, the Web graph exhibits a subtle dependence
structure with an angular measure close to uniform on ![]() . This suggests
that the PageRank popularity measure can not be replaced by
in-degree without significant disturbance in the ranking.
. This suggests
that the PageRank popularity measure can not be replaced by
in-degree without significant disturbance in the ranking.
The picture is different in Figure 2(c). In the Web, the in- and out-degree tend to be independent which justifies the distinction between hubs and authorities. In Wikipedia the degrees are dependent but this dependence is not absolute. Finally, the dependence between out-degree and PageRank in the Web and Wikipedia resembles the patterns observed for in-degree and PageRank.
These results are useful in several ways. First, they reveal some important structural features thus extending our knowledge on real-life networks. Second, by comparing the dependencies for experimental and synthetic data we can considerably improve existing graph models.
[1] http://law.dsi.unimi.it/ Accessed in January 2007
[2] R. Albert and A. L. Barab\'{a}si, Emergence of scaling in random networks, Science, 286:509-512, 1999
[3] D. Chakrabarti and C. Faloutsos, Graph mining: Laws, generators, and algorithms, ACM Comput. Surv., 38(1):2, 2006
[4] D. Donato, L. Laura, S. Leonardi, and S. Millozi, Large scale properties of the webgraph, Eur. Phys. J., 38:239-243, 2004
[5] S. Fortunato, M. Boguna, A. Flammini, and F.Menczer, How to make the top ten: Approximating PageRank from in-degree, In Proceeding of WAW2006, 2006
[6] A. N. Langville and C. D. Meyer, Deeper inside PageRank, Internet Math., 1:335-380, 2003
[7] S. I. Resnick, Heavy-tail Phenomena, Springer, New York, 2007
[8] Y.Volkovich, N. Litvak, and B. Zwart, Measuring extremal dependencies in web graphs, Memorandum 1858, http://eprints.eemcs.utwente.nl/11349/, 2007