1. INTRODUCTION
How to improve the precision of information retrieval has always been a challenging task for Chinese searching and recommendation systems, which is due to the rich yet implicit phrases/expressions in Chinese culture. On one hand, Chinese phrases/expressions can be very complicated thus rendering much burden on the searching systems, and on the other hand, the way local users interact with a Chinese website is quite different from that on an English website. To explore and elaborate this type of problems, in this paper we narrow down our focus on a particular domain, namely, Chinese recipes. Nevertheless, the methodology in this paper can also be applied to other domains with similar problems.
1.1 Motivation
Chinese cuisines are famous for their delicious taste resulted from delicate cooking skills and variant adaptation. The need of learning those cooking skills on the Web has been increasing in China; yet current on-line recipe search or recommendation systems only allow users to query by text, usually the names of the recipes. Unlike the names of western cuisines, which are typically constructed by 'past participle (cooking action) + main/minor ingredients', Chinese recipes' names are often injected with more meanings and/or bear no relationship with underlying cooking actions and ingredients:
- Some recipes are given auspicious names in hope that people who eat those dishes will be auspicious. An example of this type of recipes is 'Jin Yu Man Tang' (金玉滿堂) (Our work is based on Chinese Web, but we translate some terms into English for better understanding of readers), which can actually refer to several recipes as long as their dish appearances mainly possess both colors of yellow and white: yellow represents gold and white represents jade, both mean wealthy. However, if searching this item on Google Searc (http://www.google.com/), many words of blessings are retrieved, only few of these are related to recipes of this name.
- Some recipes are given names by anecdotes, because they are said to be originated from some folktales. For example, 'Kung-Pao Chicken' (宮保雞丁) a popular dish of Sichuan style is said to be first made by Ding Baozhen’s chef and Ding was a late Qing Dynasty official. This dish was later named after Ding’s official title 'Kung Pao' (宮保) when it was handed down from generation to generation.
- Some other recipes are given names simply by their appearance. For example, a recipe called 'Hu Die Gu' (蝴蝶骨) in Chinese means something like 'Butterfly Bone' in English. The reason for such an amazing expression is that the dish looks like several butterflies stopping on the plate. However, the correct name for this recipe in English is ‘Braised Spare Ribs’. If searching this recipe in Chinese on Google search, among the top 10 results, nearly no results are related to the recipe.
1.2 Related Work
The graph model has already been widely used in many domains. In the domain of chem-informatics and bioinformatics, ChemIDplus [6], a free data service offered by the National Library of Medicine (NLM), provides access to searching similar molecules by their substructure besides the traditional query by text. Cook et al. [2] focus on pattern recognition, and later to CAD circuit domain [4] in which structure similarity measure is used to discover similar designs. The DDIS group in Zurich [7] initiates the structure similar measure in ontology and workflows from the Web using their SimPack package. All those applications indicate the importance and wide usage of a graph model and its accompanied similarity measure sheds some light on similar search issues with respect to implicit structure similarity upon Chinese Web.
However, it is a commonly known fact that graph models have a big problem of computation with high complexity in terms of time and space; therefore, tailoring the graph model to the need of different applications is the first concern when building a graph database. Meanwhile, efficient indexing and filtering mechanisms can prune some unrelated graphs, thereby reducing the computational cost. Dennis et al. [16] build a path-based annotation by extracting subgraphs for graph matching, while Yan et al. [21] further apply feature-based indexing method on substructure patterns, in which a key issue was to generate optimal feature sets that could maximize the filtering capability.
Much work has been done to find similar parts between graphs. One approach is the graph edit distance [13, 15], in which a set of edit operations are introduced (e.g. deletion, insertion and substitution of vertices and edges) and the similarity of two graphs is defined in terms of the shortest (or least cost) sequence of edit operations which transforms one graph into the other. However, the problem on how those edit costs are obtained is still unsolved. Another approach for similarity search can be summarized as a subgraph isomorphism problem. A popular line of subgraph isomorphism is the well-known Maximum Common Subgraph algorithms [1, 3]. A comparison of three Maximum Common Subgraph (MCS) algorithms on a synthetic dataset is included in [3]. Kuramochi and Karypis [10] compare their method FSG with another computationally efficient algorithm called AGM [8] on a real chemical dataset. Though efficient enough as they claimed, they still some time to compute on relative simple graphs, even though the dataset is of a medium size.
1.3 Our Contributions
In this paper, we explore the features of a Chinese recipe database, in which recipes are crawled from the Web by our RecipeCrawler [11]. To solve the long-standing retrieval problem on Chinese Web, we propose a framework to consider documents by their inner relationship or, in other words, inter-structural similarity.
A close study of the crawled recipes reveals that we can model each recipe as a cooking graph [12]. This cooking graph is different from a common workflow, since it includes multi-edges between each pair of vertices representing action-flows and ingredient-flows. This graph model is thus of a very general form that can be used in describing very complex processes in the real world.
In response to the demand of on-line performance, we propose in this paper a filtering algorithm to firstly prune dissimilar cooking graphs from the cooking graph database before doing further match. The filtering algorithm extracts representative features from graph databases, stores them in an inverted index and then prunes dissimilar graphs according to the index. We show that this filtering algorithm is efficient and scalable, therefore can be used for on-line search. Furthermore, compared with the feature extraction of [22] which is dependent on a specific knowledge base, our method is domain-independent, therefore can be applied to other similar structure (including workflows) involving directed graphs.
We use this filtering algorithm in our RecipeView system [12], upon which the similarity is computed between each pair of recipes. A new similarity measurement is introduced and we combine it with a subgraph mining algorithm (viz., FSG [10]) to conduct common subgraph detection. We make experiments in evaluating the filtering algorithm as well as our similarity measurement upon real-world Chinese recipes crawled from the Web, and highlight the importance of examining an increasingly popular search problem in a graph database exemplified by cooking graphs. To our best knowledge, this is the first piece of work to evaluate different similarity measures on this kind of graph data.
2. TERMINOLOGY AND CONCEPT
In this section, we introduce some necessary terminologies as well as the recipe model. Then a framework is described to provide an overview of the system and its mechanisms.
2.1 Basic Terminology
A graph consists of vertices which are connected by edges. In a labeled graph, vertices and edges are associated with attributes, called labels. The attributes in our cooking graph can be classified into two types, namely, actions and ingredients. A directed edge in a directed graph connects a source vertex and a target vertex which can be determined by the edge itself. In our filtering algorithm, we use the definition of this directed edge as a feature of an action order.
More formally, a graph G = (V, E, L) consists of three sets V, E, L, denoting vertices, edges and labels of vertices, respectively. V = {vi | i = 1…n} is a set of vertices. E is a set of edges on V, and an edge (vi , vj) indicates a directed edge from vertex vi to vj, with vi being called the predecessor of vj, or in other words, vj being the successor of vi.2.2 Recipe Model Simplified
It is a common sense that cooking involves a complex procedure, which may concern several aspects and their relationships. To describe this procedure, the system should give succinct while adequate knowledge of how to prepare ingredients and how to cook step by step, as well as the specific skill in each step. To this end, we present a simplified recipe model (in comparison with [12]) to concentrate on the procedural aspect.
Definition 2-1. A recipe R is defined by a tuple of two elements:
where:
- RP is a set of recipe-level properties (and functions) applied on R itself, such as cooking style, region and images of the dish of the recipe;
- SP = (V, E, Time, Cons) is a 'Cooking Graph' which is a labeled directed graph describing the whole cooking procedure of making a dish out of recipe R. More specifically,
- In V, each vertex vi represents either a cooking action or a raw ingredient, associated with a unique timestamp Time(vi) (indicating the start time of vi), and a set of constraints Cons(vi). For an action vertex, Cons(vi)defines constraint conditions that should be satisfied when the action vi takes place. These constraints are called the 'cooking action constraints', such as the shape of an ingredient (parameter) or the temperature of the action that should be held. For example, for an action vertex 'cut', material can be cut into roasts, chops, cubes, strips or cuties. For an ingredient vertex vi, Cons(vi) mainly defines the amount of the raw ingredient. A label L(vi) refers to the action/ingredient name of vertex vi.
- In E, the directed edges represent 'action flows' or 'ingredient flows'; the former describe the temporal execution sequence of cooking actions and the latter keep track of ingredient sources.
Table 1. Cooking procedure of 'Hu Die Gu' (in Chinese) -- 'Braised Spare Ribs' (in English)
Step # |
Recipe cooking procedure in steps |
1 |
Cut spare ribs into butterfly shape. Marinate with black pepper, soy sauce, sugar and cornstarch for 30 minutes. |
2 |
Mix black pepper, honey, soy sauce, cornstarch and water. |
3 |
Heal oil. Deep-fry the spare ribs when the oil is hot. |
4 |
Remove the spare ribs when they turn brown. |
5 |
Heat oil. When the oil is hot, add the mixed sauce and stir quickly. Boil the sauce. |
6 |
Then add the spare ribs and stir briefly. Simmer for 1-2 minutes. Then remove. |
Figure 1. Cooking graph of 'Hu Die Gu' (in Chinese) -- 'Braised Spare Ribs' (in English)
In Figure 1, the corresponding cooking graph of 'Hu Die Gu' is illustrated according to the recipe model. To differentiate the two types of vertices, actions such as 'cut' or 'deep-fry' are represented by white nodes and raw ingredients such as 'spare rib' or 'black pepper' are represented by black nodes. Here a raw ingredient means the ingredient has not been processed (in any action) before. For simplicity, only one ingredient vertex is shown when there is more than one raw ingredient used in a certain action. The detailed information of time and constraints for each vertex is not shown due to space limit. Here we assume Time(vi)<Time(vj) for any i<j. From ingredient flows, we can see that the ingredients needed in a certain action are the ingredient outputs generated from its preceding actions or directly from some raw ingredients.
Figure 2 shows a simplified substructure of a cooking graph where two types of edges are unified into one type. Here a vertex v's predecessor pi (i = 1, 2, …, m) points to v (Time(pi)<Time(v)) and the latter is followed by a v's successor sj (j = 1, 2, …, n) (i.e., Time(v)<Time(sj)). Only the edge (pm, v) is selected as the forward edge of v since pm has the nearest timestamp to vamong all v's predecessors.
Figure 2. Substructure with predecessors and successors
According to Figure 2, we further define two notions below:
Definition 2-2. Pred(v) = {pi | i = 1…m}is the predecessor set of vertex v and |Pred(v)| = m is defined as the number of predecessors in Pred(v). If m>1, then for any adjacent pair pi and pi+1(i = 1…m-1), we have Time(pi)<Time(pi+1).
2.3 The Overall Framework
In our RecipeView system, the user first inputs a query by the name or description of a recipe, he/she can also quickly browse the recipe list in our system. The system then retrieves the result using the traditional method. If the user wishes to find recipes which have similar cooking skill or ingredient(s), he/she can choose 'similar recipe' to obtain the result.
At the backend of the system, we pre-compute the similarity between each recipe pairs. If new recipes are crawled from the web, additional indexes will be built accordingly, which facilitates fast computation of recipe similarities. The overall framework of our system can be best described through the following three processes, each of which is to be further elaborated in subsequent sections.
- Recipe Filtering to build the vocabulary of subgraphs of all cooking graphs: when a new cooking graph is added, simply extract the featured subgraph and add to the vocabulary; construct an inverted index to store the whole vocabulary; filter the most dissimilar recipe pairs using a threshold p.
- Recipe Similarity Measurement to compute each pair of recipes’ similarity in the filtered graph set. In this work, we use the FSG algorithm to compute common subgraph, followed by using our newly proposed measure to calculate the similarity.
- Recipe Retrieval to retrieve from the database similar recipes ranked according to the target/query recipe.
3. RECIPE FILTERING
In this section, we present our filtering algorithm to prune out dissimilar cooking graphs from the recipe (cooking graph) database. A string with q characters is called a q-gram. For two strings S1 and S2, Ukkonen [17] prove that the edit distance between S1 and S2 can be bounded by the difference within the number of q-grams. Rui [23] further apply the q-gram idea to tree structure, based on the observation that the number of edges in a tree is equal to the number of vertices minus one, so it can make various transformations to reorganize the tree-structure into a string-like form for q-gram analysis. However, graph structure is different from string or tree structure, as the number of edges in a graph may be several times larger than the number of vertices. For instance, a complete graph has n vertices and n*(n-1)/2 edges, with an exponential increase of the internal relationship information among the edges. Thus, unless we can tolerate losing some edge relationship information, it is very difficult to draw a succinct bound on graph edit distance using q-gram like algorithms designed for the strings or trees.
Nevertheless, our filtering algorithm adopts the idea of q-gram algorithm based on a careful observation of the relationship on the cooking graphs. We use Predecessor ReciSets and Successor ReciSets to retain the information of action/ingredient set, and Forward Edge ReciSet to record the most important preprocessing actions leading towards the next action/ingredient. Later experiments further show that, our system has a better pruning power than other representation models, and the system is also more sensitive towards the understanding of cooking graphs.
3.1 Cooking Subgraph Transformation
We observe that steps with multiple actions and/or ingredients are always considered as distinguished steps in a cooking graph. For example, action 'cut' is followed by action 'stir-fry' with 'sauce' added. Therefore, in the cooking graph, both the 'cut' and the 'sauce' are the predecessors of 'stir-fry' and 'cut' appears before adding 'sauce'.
To better abstract the cooking graph and retain the internal timeline relationship, we further simplify the graph by combining action flows with ingredient flows. In particular, if there exists an action edge along with an ingredient edge, in the same direction, between any two vertices, we just unify these two edges into one directed edge. More specifically, we use ReciSet to represent the temporal characters of the graph. Though it may look like feature-based at the first glance, ReciSet is in fact domain-independent, hence can be applied to other graphs in the indexing step, especially to graphs with interrelated time sequence.
Definition 3-1. (ReciSet Representation) A ReciSet is in the format of <T, v1, v2>, where T is the property indicator that represents predecessor (P), successor (S) or forward edge (F) and v1, v2 are vertices.
For Predecessor / Successor ReciSet, v1 and v2 forms an adjacent pair (cf. Definition 2-2 / 2-3). For Forward Edge ReciSet, v1 has the nearest timestamp to v2 among all v2's predecessors.
For a certain cooking graph G, the total number of all ReciSets (including all three types—Predecessor / Successor /Forward Edge ReciSet) is at most twice the total number of edges in G. This proves the scalability of our filtering algorithm, the proof of which is omitted and readers can find the details from [19].
Table 2 provides two simplified graphs G1 and G2 with ReciSet representations against the example 'Hu Die Gu' in Figure 1 in which both graphs are the subgraphs derived from the example cooking graph. The subscript number in each vertex’s label denotes the timestamp order which conforms to the vertex number in Figure 1. According to Definition 3-1, we can see that for vertex 'heat15' in the graph G1, the predecessor vertex 'oil14' has the nearer timestamp to 'heat15' than 'mix13', thus we have the Forward Edge ReciSet <F, 'oil14', 'heat15'> to indicate that the action 'heat' performs immediately after adding 'oil'. The Predecessor ReciSet <P, 'marinate7', 'heat15'> means that both 'marinate' and 'heat' are the predecessors of 'deep-fry' and 'marinate' appears earlier than 'heat'.
Table 2. ReciSet representation
The ReciSets of all cooking graphs in the recipe database constitute the whole ReciSet vocabulary, and the ReciSet distance is defined by Definition 3-2.
Definition 3-2. (ReciSet Space) The ReciSet Space RSS(G) of a graph G is the set of all ReciSets that appear at least once in G. ![]() denotes the number of RSS(G1) found in G2 and
denotes the number of RSS(G1) found in G2 and ![]() denotes the number of the occurrence of RSS(G1) found in G2.
denotes the number of the occurrence of RSS(G1) found in G2.
Definition 3-3. (ReciSet Distance) The ReciSet Distance from graph G1 to G2 is calculated on the ReciSet Space of G1. Let RSi be the i-th ReciSet in RSS(G1), then ri and ri’ are the numbers of occurrences of RSi in G1 and G2, respectively. Then the ReciSet Distance is obtained by:
![]() .
.
Definition 3-4. (Shared Percentage) For any two cooking graphs G1 and G2, the Shared Percentage Per(G1, G2) is defined as the percentage of the number of the occurrence of RSS(G1) found in G2 to the total number of occurrence of the
ReciSets in G2, i.e.,
 .
.
Obviously, RDist(G1, G2) may not be equal to RDist(G2, G1), as for different G1 and G2, their corresponding ReciSet Spaces may not contain the same ReciSets. Also, the triangular inequality may not hold, so that
ReciSet Distance is not a metric on graph data.
3.2 Cooking Graph Indexing
As mentioned earlier, an inverted index is constructed to store the whole vocabulary of all ReciSets of the recipe database. For each ReciSet, an inverted list is built to store the number of its occurrences in the corresponding graph. For example, Figure 3 shows the inverted index of G1 and G2 on the ReciSet Space of G1 (RSS(G1)) according to Table 2. There are 8 ReciSets of G1 and 3 ReciSets of G2 on RSS(G1) in which each ReciSet occurs only once. We can see that three ReciSets (RS3, RS4 and RS5) occur in both graphs G1 and G2. So the ReciSet Distance RDist(G1, G2)= 8–3=5 and the Shared Percentage Per(G1,G2)=3/11=27.3%.
Based on the inverted index, the filtering algorithm can be applied to search, after which similarity measure can be easily implemented on the candidate answer set. We will examine the actual performance in Section 5.
Figure 3. Inverted index representation
3.3 The Filtering Algorithm
Given a query graph Q and the inverted index I built for the recipe database, Algorithm 1 is formed to generate the candidate answer set CQ. Each graph in the answer set is associated with its ReciSet Distance and Shared Percentage. First the ReciSet Space of the query Q is acquired. Before a graph Gj in the dataset is visited in the algorithm, we consider it as an empty graph. The initial distance RDist(Q, Gj) is therefore set to ![]() , and the initial Shared Percentage Per(Q, Gj) is set to 0. For each ReciSet Ri that is in the ReciSet Space of Q and each graph Gj that is found in the inverted list of Ri, if Gj is not in the candidate answer set CQ, the initial distance from Q to Gj on Ri should be cleared. At each round RDist(Q, Gj) is updated to add the difference of the occurrence of Ri in Q and Gj, and the Shared Percentage Per(Q, Gj) is updated to add the number of the occurrence of Ri in Q divided by ||RSS(Gj)||Gj. The final values of ReciSet Distance and Shared Percentage should be derived once all the related ReciSets are processed.
, and the initial Shared Percentage Per(Q, Gj) is set to 0. For each ReciSet Ri that is in the ReciSet Space of Q and each graph Gj that is found in the inverted list of Ri, if Gj is not in the candidate answer set CQ, the initial distance from Q to Gj on Ri should be cleared. At each round RDist(Q, Gj) is updated to add the difference of the occurrence of Ri in Q and Gj, and the Shared Percentage Per(Q, Gj) is updated to add the number of the occurrence of Ri in Q divided by ||RSS(Gj)||Gj. The final values of ReciSet Distance and Shared Percentage should be derived once all the related ReciSets are processed.
4. RECIPE SIMILARITY MEASUREMENT
Experienced cooks always follow certain cooking patterns to prepare their meals, including some common actions and ingredients. If a certain cooking process frequently appears in many recipes, this process can be considered as a cooking technique/skill. Once a user learns how to handle those techniques, he/she will be able to handle many recipes or even to create a new dish by himself/herself. Observing this, we believe that the function to find similar recipes structurally is important. Though the goal is not easy to achieve, our RecipeView attempts to reveal all frequently used cooking processes for users to access and learn.
4.1 Discover Cooking Subgraphs
We define a Cooking Pattern as a subgraph G’ such that (i) G’ occurs in more than k cooking graphs, where k is a threshold, and (ii) G’ has at least one action/ingredient edge.
However, existing subgraph mining algorithms such as FSG [10] or gSpan [20] do not support directed graphs in which multiple edges can exist between a given pair of vertices. As it is a distinct characteristic of our cooking graphs, we develop an extended approach to make existing subgraph mining algorithm applicable to our cooking graphs.
The extensions and the process of discovering common cooking subgraphs are described as follows:
1. A “dummy” vertex vA1(cf. Figure 4) is added between two vertices
v1 and v2, if there is an action edge from v1 to v2.
We set the label L(vA1)=L(v1)+'_'+L(v2).
Figure 4. Dummy vertex insertion
Therefore, all edges belong to one type of edges. If there is an edge directly from v1 to v2, this edge represents an ingredient flow from v1 to v2. For a dummy vertex vA1, if there exists an edge from v1 to vA1 and an edge from vA1 to v2, then there is an action flow from v1 to v2.
2. The subgraph mining algorithm such as FSG is applied to the ‘modified’ cooking graphs to find cooking patterns.
3. After graph mining, three steps are needed for restoration:
-
3.1) As the derived patterns from FSG are undirected, graph matching using Ullmann’s algorithm [18] is conducted and edge direction check (as shown in Figure 5) needs to be processed.
For explanation, we take one of the derived patterns and its candidate cooking graphs which are known to contain this pattern as an example. First we apply the derived pattern to map a candidate cooking graph. Once all the vertices and edges can be mapped one by one in the candidate cooking graph, we assign the directions of all edges in the pattern same as those of the mapped edges in the cooking graph. We take this pattern as a recorded pattern. Next we use the recorded pattern to map to another candidate cooking graph. If we can’t get an exact mapping, it means that the directions of the edges in the recorded pattern are not totally the same as those in this candidate cooking graph (e.g., the recorded pattern as in Figure 5(b) and the candidate cooking graph as in Figure 5(c)). Then the original undirected pattern should be used to make a mapping to the candidate graph. The result pattern is considered as another recorded pattern.
If all candidate cooking graphs get mapped, we remove any recorded pattern if it does not satisfy a given minimal support threshold. Then the remaining record patterns are what we need.
Figure 5. Edge direction check
3.2). Remove dummy vertices: to remove all the dummy vertices so as to restore the action flows and ingredients flows in the pattern.
3.3). Remove duplicated patterns: after we remove all the dummy vertices, some duplicated patterns may occur. So we have to check and remove them.Note that there could be more than one cooking technique used in a particular recipe, and our system is capable of identifying all of them so as to enable the users to know how many and what patterns are contained in the recipe. By learning the combined sequence of different patterns in the same cooking graph, a user can get a rough sense of the structure and the style of the recipe/dish.
4.2 Recipe Similarity Calculation
Based on the structure of cooking graphs, we proceed to propose a novel graph-based similarity calculation method which is radically different from normal text-based or content-based approaches. Using this method, users can perform similarity search over the graph structure, shared characteristics, and distinct characteristics of each recipe.
Suppose SP1 is the cooking graph of recipe R1 and SP2 is the cooking graph of recipe R2. Assuming SP1 and SP2 share m subgraphs SPSi (i = 1 .. m), then the structure similarity of recipes R1 and R2 is calculated as follows:
where |ESi| is the number of edges (including both action and ingredient edges) of the subgraph SPSi; |ESAi| and |ESIi| are the numbers of action and ingredient edges in SPSi respectively (i.e. |ESi| = |ESAi|+|ESIi|); N is the total number of recipes; dSi is the number of cooking graphs that contain subgraph SPSi; log2(N/dSi) is the inverse subgraph frequency, the purpose of which is to make rare common subgraphs more important than frequent ones. Since different user queries may emphasize more on either the flavor (affected by ingredient flow) or the cooking skill (affected by action flow), we use μ and γ as the weights for action and ingredient edges, which are adjustable. Per(SP1, SP2) is pre-calculated in graph filtering; intuitively, the larger Per(SP1, SP2) is, the more similar SP1 and SP2 look like to each other.
In the above formula, the similarity of two cooking graphs is calculated based on the common subgraphs shared by them (Note that each part is normalized before multiplication). It takes both local and global views into consideration. Per(SP1, SP2) shows the similarity based on the paired graphs. If the two graphs are the same, their Per(SP1, SP2) is one. On the other hand, log2(N/dSi) considers the importance of the subgraph in the whole graph database. A popular action (e.g. heat oil) in two graphs is not distinguishing enough to conclude if the two recipes are really similar to each other. In sum, the higher the score is, the more similar two cooking graphs resemble each other. By using this method, users are able to retrieve similar recipes in terms of cooking processes even though the names of the recipes may be totally different.5. EXPERIMENT
As part of our research, we have conducted a series of four experiments upon our RecipeView system. The first two belong to performance study, in which we examine the efficiency of our filtering algorithm, as well as comparing it to other ones. The next two actually run two implemented algorithms comprehensively on the RecipeView system to examine their retrieval effectiveness and efficiency.
The judgement of determining whether a recipe is relevant to the queried recipe is somewhat different from traditional ones. For the vector space model [14], only word frequency is mainly considered. But in our judgement, not only ingredients are considered but also the way of cooking (i.e. cooking procedure) is taken into account. For example,
'Chengdu Young Chicken' and 'Fried Spareribs in Orange Juice' are regarded as relevant because they share most of the cooking procedures (cf. Figure 8).
5.1 Filtering Algorithm Performance Study
In this part of the experiments, we conduct the empirical studies to examine the properties of our filtering algorithm. We use a recipe database containing 103 Chinese cooking graphs (with 51 Guangdong style dishes and 52 Sichuan style dishes), which are some of the most representative and popular recipes in Chinese cuisine. These cooking graphs consist of 34.4 vertices on average (ranging from 15 to 56), and 45.2 edges on average (ranging from 20 to 80). After segmentation, a vocabulary of 5739 ReciSets is generated.
Figure 6. Percentage of data retrieved for Per(Q, *) >= p
First let’s check the performance of Shared Percentage Per(Q, *) where * denotes the graphs to be compared with the query graph Q. Here we temporarily exclude out ReciSet Distance (RDist) from consideration, but we will add this factor in the later experiment. Figure 6 shows that the percentage of data (cooking graphs) is retrieved when the condition Per(Q, *)>= p holds with the variable p. When p equals to 0 (i.e. Per(Q, *) does not have any effect), the candidate set contains a large number of related cooking graphs of Q. We can see that in this data set, all cooking graphs share some common parts with one another. When p is increased from 20% to 40%, the size of the candidate set decreases sharply from 75% down to 14% of the original set. When p reaches 60%, the candidate set is almost empty. The result shows that p has a strong pruning power in filtering out graphs.
We further calculate the precision, recall and F-measure to see if the retrieval performance is improved by our filtering algorithm. Here:
Note that the F-measure is the weighted harmonic mean of precision and recall (i.e. precision and recall are evenly weighted); the larger the F-measure is, the better the performance is.
Table 3. Precision and recall for Per(Q, *) >= p
p (%) |
0 |
10 |
20 |
30 |
40 |
50 |
Precision |
0.207 |
0.217 |
0.274 |
0.425 |
0.585 |
0.515 |
Recall |
1 |
1 |
0.977 |
0.882 |
0.453 |
0.126 |
F-measure |
0.343 |
0.356 |
0.428 |
0.574 |
0.511 |
0.203 |
Table 3 shows that the retrieval performance is obviously improved (p=20%~ 40%) after filtering.
In the following experiment, we add the factor of ReciSet Distance RDist(Q, *). The cooking graphs are retrieved under the conditions Per(Q, *)>=p and RDist(Q, *)<=(1- x)MaxRDist(Q, *) where MaxRDist(Q, *) is the maximum value of RDist(Q, *) corresponding to the query graph Q. Table 4 shows the values of F-measure when p ranges from 0 to 50% and x ranges from 10% to 25%.Table 4. F-measure for both Per(Q, *) >= p and RDist(Q, *) <= (1- x)MaxRDist(Q, *)
p (%) |
0 |
10 |
20 |
30 |
40 |
50 |
10 |
0.438 |
0.439 |
0.457 |
0.577 |
0.512 |
0.203 |
15 |
0.496 |
0.497 |
0.497 |
0.583 |
0.505 |
0.203 |
20 |
0.541 |
0.542 |
0.537 |
0.594 |
0.513 |
0.203 |
25 |
0.560 |
0.560 |
0.562 |
0.581 |
0.468 |
0.205 |
The values of F-measure are generally larger than those in Table 3, which means the retrieval gets better performance when ReciSet Distance is taken into consideration. The optimal value of p and x can be found in the shaded area (p=20%~40% and x=15%~25%) to get the largest value of F-measure. After calculating all the shaded area, the largest value of F-measure (=0.623) is found when p=35% and x=18% (precision=0.576, recall=0.677). Under this condition, about 28% cooking graphs have been retrieved.
This demonstrates the efficiency and suitability of our algorithm for on-line graph-matching applications, particularly Chinese recipe retrieval.5.2 Further Evaluation
In this second part of experiments, we first try to determine the weights μ and γ for Formula (1) by conducting a set of experiments on our recipe data. First we fix μ to 1 and change the value of γ so that we can see the performance of precision and recall under different values of γ. We calculate the precision and recall based on the top 10 retrieved recipe results because users usually view the top 10 results with interests and may not be patient for the later results.
Table 5. Comparison of precision and recall under different γ (μ=1)
γ |
0.1 |
0.5 |
1 |
2 |
10 |
Precision@10 |
0.716 |
0.734 |
0.778 |
0.771 |
0.747 |
Recall@10 |
0.313 |
0.321 |
0.362 |
0.354 |
0.326 |
F-measure |
0.436 |
0.447 |
0.494 |
0.485 |
0.454 |
According to the experiment results (Table 5), the precision is over 0.7 under each γ (γ varies from 0.1 to 10 where μ=1), which means that this similarity calculation method gets a good retrieval performance in general for top 10 results. When γ=1, F-measure gets the best result. So we use μ=1 and γ=1 and Formula (1) becomes the following:
Then we further compare Formula (2) with Formulas (3) and (4) below:
The difference between Formula (2) and (3) is that |ESi| is squared in Formula (2). Formula (4) is the typical graph distance measure based on the maximal common subgraph (MCS) [1], for which the smaller the graph distance is, the more similar two graphs look to each other. |mcs(SP1,SP2)| denotes the number of vertices in the maximal common subgraph of two graphs SP1 and SP2. |SP1| and |SP2| are the numbers of vertices in SP1 and SP2, respectively. Then
Table 6. Comparison of precision / recall for Formulas (2) - (4)
Formula |
(2) |
(3) |
(4) |
Precision@10 |
0.778 |
0.712 |
0.600 |
Recall@10 |
0.362 |
0.334 |
0.281 |
F-measure |
0.494 |
0.455 |
0.382 |
In Table 6, we list the precision and recall over the top 10 retrieved recipe results by using Formulas (2) – (4) separately. Obviously Formula (2) performs significantly better than either Formula (3) or Formula (4), so we adopt Formula (2) as our recipe similarity measure.
Next we compare our graph-based similarity measurement with text similarity measurement (using baseline vector space model [14]). We evaluate the performance of both algorithms using traditional precision and recall. At the end, we present a comprehensive case to facilitate a better understanding of our whole system.
Figure 7. Precision and recall curve for graph similarity measurement and text similarity measurement
From Figure 7, we can conclude that our graph-based similarity measurement gains a far better improvement in retrieval performance than text similarity measurement. Under the same recall rate, the former has an approximately twice precision rate as the latter in the interval from 0.2 to 0.9. The reason for this improvement mainly attributes to the cooking graph structure. Taking the advantage of abstracting the workflow of a recipe document into a graph, it contains more semantic information describing the procedure of data, when compared with simple statistical text representation of the vector space model. Consider, e.g. the two recipes 'Kung Pao Pork' and 'Kung Pao Chicken' which are very similar (by our graph-based similarity measure in terms of cooking procedure) albeit with different main ingredients, the vector space model may not give this pair a high similarity value because different terms/main ingredients are used in each recipe; it may also suffer from the correlation problems. In addition, another reason may be due to the different pre-processing we conduct. For the vector space model, we only remove stemming words, such as 'a', 'the', as well as html tag. While for graph conversion, our (currently) manual process can cleanse most (if not all) of the dirty data. Consequently, the retrieval result (which is ranked by similarity score) shows that the top results from the graph similarity method are very similar to the query recipe, which is not the case in the text similarity measurement. This result further confirms that using cooking graphs is the major reason for the performance improvement.
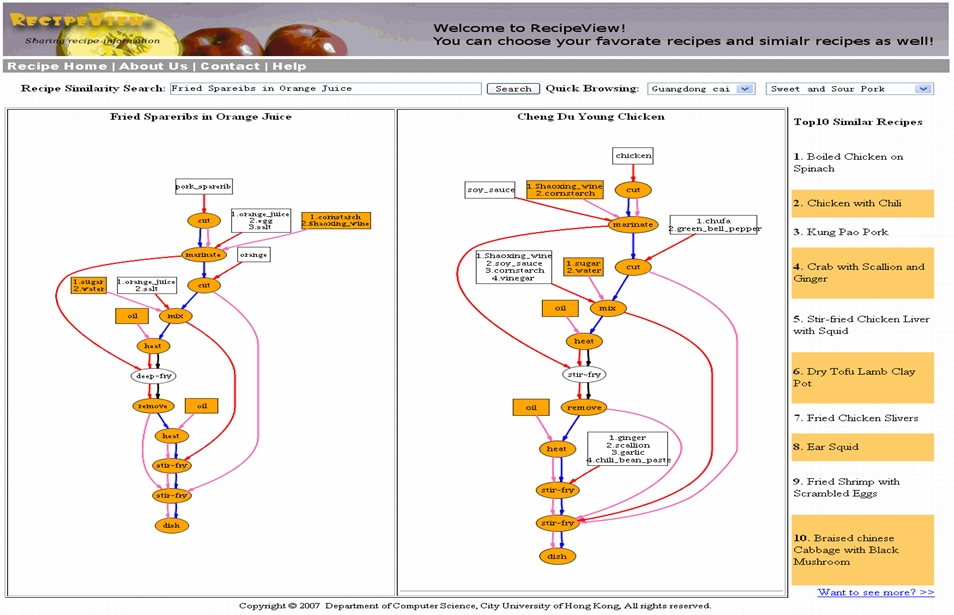
Figure 8. RecipeView screenshot: the target recipe (left window) with its most similar recipe (right window), and other top 10 similar recipes (shown on the right column)
To provide a more complete picture of our RecipeView system, we give an example in Figure 8 which shows a query 'Fried Spareribs in Orange Juice' submitted by a user and the results derived from the system. In particular, the system finds the recipe upon receiving the query string, and then the particular recipe graph is retrieved and displayed in the left window. Meanwhile, similar recipes are listed on the right column with 10 recipes per page. The corresponding cooking graph is shown in the 2nd (from left) window if the user clicks on one of them. Common parts between the two recipes are highlighted in orange color. If a user moves the mouse across the vertices or edges, some popup information is displayed indicating the associated constraints. For the two cooking graphs in Figure 8, it can be seen that the two recipes are structurally rather similar to each other (except for the main ingredient and some minor ingredients), even though their names are totally unrelated. This kind of 'substructure similarity' search would not be possible by using a traditional method. Moreover, by carefully examining the top 10 recipes returned, we find that they all belong to the same cooking style, and have some important actions/ingredients in common. This demonstrates the effectiveness of using the frequent common graph-based graph matching, based on which interesting and semantically meaningful results are obtained. However, the action 'deep-fry' in the left window is not regarded the same as 'stir-fry' in the right window (without an orange color in the vertex) by FSG. Therefore, more work could be done to make FSG more error-tolerant.6. CONCLUSION
Improving the precision of information retrieval has been a challenging issue on Chinese Web. As exemplified by Chinese recipes on the Web, it is not easy/natural for people to use keywords (eg, recipe names) to search recipes, since the names can be literally so abstract that they do not bear much, if any, information on the underlying ingredients or cooking methods. In this paper we have explored and elaborated this type of problems in the context of RecipeView, aiming to solve complicated semantic computing problems as exemplified by retrieving Chinese recipes on Chinese Web. In particular, we draw our effort on translating recipes into directed graphs, and making use of a graph mining approach to extract useful features (patterns). To accommodate powerful and semantically meaningful search that can better cater for specific user needs, we have introduced and incorporated into our RecipeView system a filtering algorithm and a new similarity measurement suitable for complex graphs embodying cooking graphs. It has been demonstrated that our filtering algorithm is efficient in facilitating the process of similarity search; in addition, its scalability allows an application to update similarity records on the fly. Our newly proposed similarity measurement features graph structure well, and can be combined with frequent subgraph
mining to handle graph-based similarity search. Based on the RecipeView
prototype system, we have tested the precision /recall based on our method
compared to another graph matching approach (MCS). The results also shed
light on the suitability and usability of different algorithms for
applications involving complex graph data.
In addition to recipes, any other types of data with operational sequence features can make use of the modeling framework we have proposed, including for example Web services and medical care domains. Our future work lies in data quality assurance for such application domains, in particular (semi-)automatic dirty data identification and correction. Another interesting issue for future research is to support (personalized) user adaptations and provide recommendations for error handling in the course of recipe execution.
7. ACKNOWLEDGMENT
Part of the work was done while Guozhu Dong was visiting the Zhejiang Normal University, where he is a guest professor.
The work described in this paper has been supported, substantially, by a grant from the Research Grants Council of the HKSAR, China [Project No. CityU 117405], and a Strategic Research Grant of City University of Hong Kong [No. 7002212].