Figure 1: String images.
The role of Web images is an important issue for Web browsing using a mobile device. For example, many commercial products and research studies [2][7][9] focus on how to reconstruct Web pages to fit the size of screens on mobile devices as a way to improve their browsing capabilities. In doing so, some Web images should be discarded or downsized to fit in the page layout of the small screen. However, most studies and commercial products are prone to serious errors in detecting such images because of their simple image detection mechanisms. A good example of this problem is a case in which images for a site menu are deleted or reduced, making it impossible for mobile users to read the text in the images. Here, by appropriately detecting the roles of the images, we would be able to correctly process them. For example, if an image acting as a site menu has an ALT string, the image can be replaced by that string. If it doesn't have an ALT string, the image should be displayed without any modification.
A few studies aim to develop applications for automatically providing images associated with the main contents of a Web page as a way to minimize user operations because mobile devices usually have poor input interface [3]; e.g., most cellular phones have only 4-way keys and numeric buttons. Some of these studies treat specific Web pages whose structures are well-known and thereby reduce the cost of extracting images associated with the main contents. Here, by appropriately detecting the roles of Web images, we can extract such content images from any Web page.
There have been many studies on handling Web images for mobile Web browsing. However, most of these do not treat Web images carefully. That is, they assess the role or importance of a Web image from only simple features such as its width, height, and aspect ratio. In contrast, to properly handle Web images and to promote the development of new Web applications for mobile devices, we defined eleven categories associated with the roles of Web images. Then, we manually classified 3,901 images collected from various Web sites (40) into the eleven categories. The manual classification shows that 37 image features efficiently classify images, and we used these features to develop an automatic Web image classification method that uses a decision tree made from the image features.
There are four ways to extract features from Web images: (1) use HTML source file analysis, (2) query Web servers, (3) exploit the layout information of DOM trees when rendering the pages, and (4) use image processing. In mobile environments, the image features that can be extracted depend on the performance and functionality of the mobile devices and the communication environment. Extractable features also depend on the environment surrounding the devices. For example, if a proxy server is available, the mobile devices can extract all of above features. On the other hand, some applications don't require eleven role categories and require accuracy for only specific ones. Therefore, we evaluated our automatic classification method according to the features that are available in different environments. The results show that under certain conditions, the method achieves up to 83.1% classification accuracy.
The rest of this paper is organized as follows. Section 2 defines the eleven image categories, and section 3 explains a few applications of Web image classification. Section 4 discusses related work. Section 5 explains the results of a manual classification of Web pages and image features that are to be used for automatic classification. Section 6 presents the evaluation of the method, and section 7 describes an implementation of an image classification application. Section 8 gives further considerations on our method, and section 9 concludes the paper.
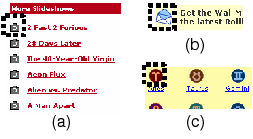
We define eleven categories for image classification and provide a brief explanation about the features of each category based on an examination of actual images collected in section 5. Four categories have images that include text and we will refer to these as string images. Moreover, two categories have images that are of the tiny size and we will refer to these as small images.
The four categories with string images are:
Two categories have small images:
Other five categories:
Web image classification can be used for various mobile Web browsing applications. In the following, we describe a few such applications.
There are many studies on overcoming the limitations of mobile devices and supporting Web browsing activities by analyzing Web pages. For example, Chen et al. [4] proposed a Web page segmentation method that segments a Web page into components whose sizes are enough small to be displayed on small screens. Mobile users can browse each small component composing a large Web page. In [8], we proposed a collaborative Web browsing system for multiple nearby mobile users, where each of the components of a page is delivered to a different user's device and users collaboratively browse the page by discussing and watching each other's displays. Here, the key technology is the component detection that determines where to split the text and images appearing on the Web page. Many studies that address component detection detect the positions of separators of components by using HTML tag analysis and image analysis of the rendered Web page.
We believe that image features can be a more precise means of separator detection. For example, if successive MENU images are detected, the separators are set so that these MENU images become a component. If a SECTION image is detected, the separator is set in the upper portion of the image.
While some studies choose images with small widths and heights or those with very small aspect ratios as the separators, such a simple approach cannot precisely detect separators. For example, if images with widths and heights of equal or less than 10 pixels are defined as the separators, 32.0% of the collected images are improperly categorized.
As explained briefly in section 1, there are many studies and commercial products that focus on reconstruction of Web pages for mobile devices. For example, Anderson et al. [1] implemented an application to provide personalized Web pages for small-screen devices by discarding contents thought to be unnecessary by referring to the users' browsing histories. In such applications, the roles of images are important factors when deciding which contents should be discarded. For example, as for an itemization like in Figure 2(a), we can decide which items are unnecessary by looking at the browsing histories and users' preferences. This operation can only be performed for ITEM images. Even if we analyze the text and determine that some sentences are unnecessary, line head ITEM images cannot be eliminated without determining the images' categories. In contrast, we can eliminate little-used MENU images. We can also eliminate text following SECTION images and leave the images as summaries.
As described in section 1, mobile browsers such as ``Opera for Mobile''[9] reduce or delete images in order to reconfigure the page so as to fit the width of the screen. Here, deleting images may degrade the readability of the Web pages. For example, suppose that texts are extracted from an itemization that is described by using table tags and the extracted texts are displayed without line feed by discarding the table layout. This frequently occurs in conventional applications because discarding the table layout is effective for content browsing on small screens and line head images in an itemization tend to be deleted to reduce the pages' size. However, this makes the items indistinguishable to the users because the texts of all items are connected. In contrast, by detecting the roles of images, our policy is not to eliminate or replace ITEM images.
Automatic scrolling is an example of passive and rapid content browsing using image classification. In this application, the region occupied by each component is detected by using HTML tag analysis and image classification. Then, the page is automatically scrolled, and the contents of all components are traversed by the browser. This enables users to passively browse the unreconfigured page in a minimum number of operations. Here, the role of images can be used for determining the paths of automatic scrolling inside the components. For example, a component including a SECTION image, a CONTENT image and text can be presented by setting the scrolling path to traverse the SECTION image, CONTENT image, and text in order. Regarding a component including ITEM images, each corresponding item should be traversed in order. Moreover, regarding a component including AD images, the scrolling speed should be set higher. The details of the implementation of this application are described in section 7.
Image classification is useful for several other applications besides mobile ones. It is useful in a Web image search engine to categorize search results and to determine which crawling policies should be used. For example, since CONTENT images are important for image searches and their update intervals are usually short, the crawling intervals for CONTENT images should be set shorter.
As mentioned above, there is no work on automatically categorizing images on general content Web pages before ours. Paek et al. [10] defined five categories of Web images, and extracted only content images from Sony's and BBC's sites. They defined ``Advertising images,'' ``Content images,'' ``Decorative images'' as buttons and section headings, ``Informational images'' as warnings, ``Logo images,'' and ``Navigation images'' as buttons to home. To extract content images, they used features extracted mainly with image processing and not by HTML analysis. In addition, because their approach analyzes ALT strings, it can only be applied to Web pages in a specific language.
Hu and Bagga [6] defined seven categories of Web images on news sites such as those of the BBC and CNN. They defined a ``story'' category which contains images whose content is associated with a news story. They also defined a ``preview'' category which contains images whose content is associated with a preview of a news story, a ``commercial'' category, a ``host'' category which contains images for representing a column or a TV program, a ``heading'' category which contains text and serves as a heading for a column or a section, and an ``icon logo'' category. Their purpose was to extract important ``stories,'' ``previews,'' and ``headings,'' and they used simple features extracted by HTML and text analyses and image processing. Their approach focuses on only news sites; whereas our approach can deal with various Web sites such as portal sites and shopping sites. Moreover, we consider the restrictions of mobile environments.
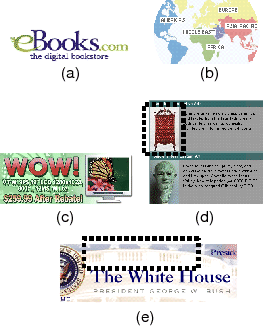
First, we collected 3,901 images from the index page and two randomly selected pages from the 40 sites (20 U.S. sites and 20 Japanese sites) listed in Table 1. These sites included eight portal sites, ten news sites, seven commercial sites, six shopping sites, and nine other sites. The two pages that were selected were cross-linked to the index page and thought to be important on the site. After that, we manually categorized the 3,901 images collected from the 40 sites into the eleven categories defined in section 2. When an image appeared multiple times on the same page, we focused only on the first one and ignored the others.
Table 1: Forty Web sites.
| msn.com | google.com | walmart.com |
| ebooks.com | buy.com | nationalgeographic.com |
| weather.com | nbci.com | metmuseum.org |
| abc.go.com | flowgo.com | en.wikipedia.org |
| ed.gov | lycos.com | whitehouse.gov |
| intel.com | hp.com | sonymusic.com |
| wired.com | nytimes.com | yahoo.co.jp |
| goo.ne.jp | amazon.co.jp | ntt.com |
| nhk.or.jp | honda.co.jp | reuters.co.jp |
| asahi.com | sankei.co.jp | casio.co.jp |
| nifty.com | nikkei.co.jp | jp.fujitsu.com |
| infoseek.co.jp | nnn24.com | watch.impress.co.jp |
| livedoor.com | rakuten.co.jp | ufjbank.co.jp |
| chunichi.co.jp |
Table 2: Distribution of collected images.
| MENU | SECTION | DECORATION | BUTTON |
| 686 | 469 | 69 | 87 |
| ITEM | ICON | TITLE | MAP |
| 311 | 264 | 141 | 53 |
| AD | CONTENT | LAYOUTER | |
| 329 | 951 | 541 |
Table 2 shows the results of the manual classification. Some images were difficult to categorize. Below we list some examples of how we categorized such exceptional images:
We explained locational and shape features that were to be used for image classification in section 2. However, some images are difficult to distinguish by using only these features. In the following, we describe image features to distinguish such images by using image processing.
MENU and SECTION images in the upper portion of the page
usually have similar aspect ratios as TITLE images. However, in
terms of their contexts, TITLE images are more complex because
they have logo marks and much more decorative text. Here, we
focused on the number of colors and concolorous regions in the
image. A concolorous region is defined as a set of four connected
pixels with the same color. The MENU, SECTION, and TITLE images
had on average 42.32, 40.53, and 89.58 colors, respectively. The
MENU, SECTION, and TITLE images had on average 22.79, 41.83, and
109.55 concolorous regions, respectively. Consequently, there
were large differences between the number of colors and the
number of concolorous regions among the images of the three
categories. We confirmed significant differences between these
values in MENU and TITLE, and those in SECTION and TITLE by
t-test(![]() ). Note that the average
number of colors was calculated by using only GIF pictures.
). Note that the average
number of colors was calculated by using only GIF pictures.
92.8% of SECTION and 16.1% of BUTTON images had neighboring text below them. SECTION and large BUTTON images had similar aspect ratios. However, the average number of concolorous regions differed greatly between the two categories (BUTTON images had 26.90 and SECTION images had 41.83, on average).
It is difficult to distinguish MENU images and SECTION images
from vertically in-line AD images if they are at the left of the
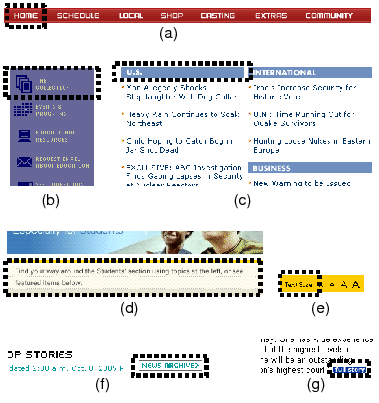
page. Since MENU and SECTION images have neighboring images with
similar designs and colors like in Figure 1(a), (b), and (c), we define the
similarity between images ![]() and
and
![]() by using the following
formula:
by using the following
formula:
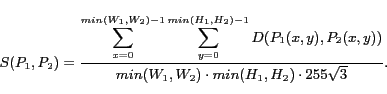
Here, ![]() and
and ![]()
![]() denote the width and
height of
denote the width and
height of ![]()
![]() , respectively.
, respectively. ![]()
![]() denotes the pixel value
at position (
denotes the pixel value
at position (![]() ,
,![]() ) in
) in ![]() .
. ![]() denotes the Euclidean distance between
pixels
denotes the Euclidean distance between
pixels ![]() and
and ![]() in the RGB space. We use the minimum similarity
between an image and its neighboring images as a feature for
classification. Here, a neighboring image is defined as an image
such that the distance between the index values of img
tags corresponding to an image and the (neighboring) image is not
more than 30. Note that an index is the order of a tag in the
HTML source. In addition, the similarity is computed only between
similar-shaped images whose widths or heights are the same. The
average minimum similarities of MENU, SECTION, and AD images that
had similar shapes were 0.139, 0.136, and 0.373, respectively. We
confirmed that there were significant differences between the
average minimum similarities of MENU and AD and those of SECTION
and AD by t-test(
in the RGB space. We use the minimum similarity
between an image and its neighboring images as a feature for
classification. Here, a neighboring image is defined as an image
such that the distance between the index values of img
tags corresponding to an image and the (neighboring) image is not
more than 30. Note that an index is the order of a tag in the
HTML source. In addition, the similarity is computed only between
similar-shaped images whose widths or heights are the same. The
average minimum similarities of MENU, SECTION, and AD images that
had similar shapes were 0.139, 0.136, and 0.373, respectively. We
confirmed that there were significant differences between the
average minimum similarities of MENU and AD and those of SECTION
and AD by t-test(![]() ).
).
Large BUTTON images were similar in shape to SECTION and AD images. Small BUTTON images were similar in shape to ICON images. To distinguish them, we used a feature often found in BUTTON images. As shown in Figure 1(f) and (g), many BUTTON images are rectangles with round corners. Actually, 37.9% of BUTTON images in our data set had this shape. On the other hand, only 1.9% of SECTION, 6.1% of AD, and 7.2% of ICON images had this shape.
By detecting text in images, we can distinguish string images or images including text such as TITLE images from other images. For example, although LAYOUTER images have various shapes, are located throughout the page, and are sometimes mistaken as SECTION, DECORATION, and TITLE images, the presence of text can distinguish them. In addition, AD images usually have multiple texts in different positions; e.g., the image shown in Figure 3(c) has multiple text areas with different font types. On the other hand, most MENU and SECTION images have one text region, like those in Figure 1(a) and (c).
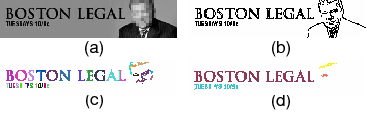
Although there are many algorithms to detect text areas in Web images, we incorporate a part of the algorithm proposed in [11] into our method. The algorithm works as follows:
We applied the above algorithm to our experimental images and found that many areas that are not actually text are detected as text. Figure 4(c) shows a result of executing the algorithm, where a human face is recognized as text. Therefore, we revised the algorithm as follows. After filtering the groups produced by the above algorithm by considering the number of holes, aspect ratio, dimension, and so on [14], the groups that are horizontally in-line and of a are similar to each other are merged. Accordingly, a text line can be extracted. Finally, by filtering those groups with larger aspect ratios, we can get the final result (Figure 4(d)). We also applied above algorithm to reversed images.
We evaluated the accuracy of the revised algorithm by adapting it to all of our collected images. For 79.70% of the images, most of the text regions were detected with a small amount of noise and/or most of the regions without text were not detected as text. For 10.18% of the images, about half of text regions were detected or a certain degree of noise was included. For 10.13% of the images, text regions were not detected properly and/or regions without text were detected as text regions by mistake.
The average occupancy ratios of text regions in LAYOUTER,
SECTION, DECORATION, and TITLE images were 0.40%, 37.89%, 55.19%,
and 44.85%, respectively. On the other hand, the text regions in
AD, MENU, and SECTION images averaged 2.75, 1.04, and 1.19,
respectively. There were significant differences in the number of
text regions between AD and MENU, and between AD and SECTION, by
t-test(![]() ).
).
Based on the discussion in section 2 and this section, the image features used for automatic image classification are listed below. Features F1 to F20 are extracted by HTML source analysis. If the width and height of an image are not specified in img tag, these values are set as missing. F21 and F22 are acquired when downloading images or sending a request to the Web server by using the HEAD method. F23 to F30 are extracted from the MSHTML DOM Tree parser when rendering a page. F31 to F37 are extracted by image processing. As for the GIF animation, image processing is performed on the first frame.
Now, we briefly explain a method for finding a neighboring text to determine F11 and F30. The tag structure of the HTML source is basically a tree. Thus, after searching for a text from sibling nodes of the current node according to img tag, our method searches for a text from sibling nodes of the parent. This procedure is repeated until a text or a large image is found. When searching for a text from sibling nodes, only the four closest nodes are searched in order. In addition, the number of tracking back ancestors is limited to three. Consequently, our method can find neighboring text without using the HTML DOM tree.
In our experimental evaluation, we built a decision tree that categorized images in a training set into the eleven categories according to the image features described in sections 2 and 5. By using the decision tree, we then categorized images in a test set. We used C4.5 [13] to build the decision tree. Specifically, we performed forty tests, in which images at a Web site among the forty sites shown in Table 1 were chosen as the test set and images at the rest of thirty nine sites were chosen as the training set. We show the results for the following five cases.
Table 3 shows the classification accuracies of C1 to C5. Here, accuracy is defined as a percentage of correctly classified images. From these results, we can see that by using only features extracted by HTML source analysis, 75% of images are classified correctly, even though we did not use features acquired from the DOM Tree. The larger the number of features used is, the higher the accuracy becomes. However, the accuracy of C4 is little lower than that of C2. Comparing C4 and C5, we see that the accuracy of C5 with features acquired from the DOM Tree is much higher. Comparing C3 and C5, we see that C5 with features acquired by image processing achieves a much higher accuracy. These results indicate that features acquired by image processing work effectively when combining with features acquired from the DOM Tree. In addition, while C2 has only two more features than C1, the accuracy of C2 is much better than that of C1.
Table 4 shows the F-measure for each category of C1 to C5. The F-measure is calculated from the precision and recall of each category by the following formula:
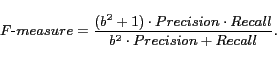
Here, ![]() equals 1. The F-measure is a
criterion to represent the classification accuracy, where the
maximum value is 1.
equals 1. The F-measure is a
criterion to represent the classification accuracy, where the
maximum value is 1.
Table 4: F-measure.
| C1 | C2 | C3 | C4 | C5 | |
| MENU | 0.854 | 0.886 | 0.852 | 0.826 | 0.876 |
| SECTION | 0.749 | 0.742 | 0.863 | 0.772 | 0.867 |
| DECORATION | 0.177 | 0.106 | 0.109 | 0.173 | 0.294 |
| BUTTON | 0.392 | 0.364 | 0.360 | 0.365 | 0.458 |
| ITEM | 0.578 | 0.652 | 0.800 | 0.567 | 0.834 |
| ICON | 0.388 | 0.477 | 0.647 | 0.539 | 0.673 |
| TITLE | 0.676 | 0.725 | 0.732 | 0.681 | 0.801 |
| MAP | 0.981 | 0.981 | 0.981 | 0.971 | 0.971 |
| AD | 0.716 | 0.744 | 0.657 | 0.705 | 0.694 |
| CONTENT | 0.888 | 0.882 | 0.906 | 0.911 | 0.911 |
| LAYOUTER | 0.746 | 0.761 | 0.787 | 0.844 | 0.880 |
In every case, the F-measures of DECORATION and BUTTON are low. This is because these two categories don't have specific features that can distinguish them from other categories. However, their F-measures increase as more the number of usable features increases because the characteristics of other categories become more conspicuous.
The F-measures of ICON and AD are uniformly low. ICON also doesn't have specific features that can distinguish it from other categories. However, as the number of usable features increase, the F-measure increases as it did in the cases of DECORATION and BUTTON. On the other hand, while AD has an F-measure of 0.744 in C2, the F-measure in C3 is much lower. This is because AD images are often mistaken as MENU images because of F27 and F30. However, the image processing of C5 improves the F-measure of AD.
The F-measure of ITEM increases greatly by using features acquired from the DOM Tree. This is because ITEM images that are often mistaken as ICON and LAYOUTER images can be distinguished correctly by using F27 and F30.
The above results indicate that although our method cannot support applications that require the precise recognition of DECORATION and BUTTON images, it is very useful for most applications described in sections 1 and 3. Moreover, since C3 shows good accuracy in each category except for DECORATION and BUTTON, applications to support users' Web browsing activities can be executed by using Web page rendering functions even though the mobile devices might lack enough performance to perform image processing. Even devices that can use only C1 or C2 features can execute applications of Web page reconfiguration and personalization by using the roles of images. However, since the accuracy of ITEM is slightly low, it should be improved by HTML source analysis.
| IC1 | IC2 | IC3 | IC4 | IC5 | IC6 | IC7 | IC8 | IC9 | IC10 | IC11 | Image Category |
| 611 | 2 | 0 | 14 | 0 | 15 | 6 | 0 | 33 | 1 | 4 | IC1: MENU |
| 4 | 413 | 8 | 6 | 3 | 2 | 2 | 0 | 16 | 8 | 7 | IC2: SECTION |
| 0 | 21 | 16 | 2 | 8 | 7 | 3 | 0 | 3 | 1 | 8 | IC3: DECORATION |
| 16 | 5 | 4 | 41 | 0 | 8 | 1 | 0 | 9 | 3 | 0 | IC4: BUTTON |
| 0 | 1 | 0 | 0 | 252 | 46 | 2 | 0 | 0 | 0 | 10 | IC5: ITEM |
| 5 | 2 | 1 | 6 | 20 | 190 | 0 | 0 | 0 | 19 | 21 | IC6: ICON |
| 10 | 4 | 9 | 0 | 0 | 1 | 111 | 0 | 4 | 2 | 0 | IC7: TITLE |
| 0 | 2 | 0 | 0 | 0 | 0 | 0 | 50 | 0 | 1 | 0 | IC8: MAP |
| 40 | 13 | 0 | 20 | 0 | 1 | 7 | 0 | 235 | 11 | 2 | IC9: AD |
| 20 | 19 | 0 | 2 | 0 | 9 | 4 | 0 | 39 | 850 | 8 | IC10: CONTENT |
| 3 | 2 | 2 | 1 | 10 | 22 | 0 | 0 | 9 | 20 | 472 | IC11: LAYOUTER |
Table 5 shows the superimposed confusion matrix of forty tests of C5. Similar to the above results, MENU and AD images are often mistaken for each other because of their similar features. Moreover, SECTION and AD images are often mistaken for each other. These errors could be corrected by using F33.
Since ICON images have no specific rule about their position on the page, they are often mistaken as LAYOUTER images. In addition, large ICON images tend to be classified as small CONTENT images. In particular, large ICON images with neighboring text on the right are difficult to distinguish from small photographic CONTENT images in GIF format. This is because, in the manual classification, we categorized photographic images as CONTENT even if they were somewhat small for some degree. Moreover, some ICON images are incorrectly classified as ITEM images and vice versa. This is because ICON images with large F27 values are often mistaken as ITEM images.
Some CONTENT images are incorrectly classified as MENU or SECTION. CONTENT images with only simple text are often classified incorrectly. In addition, many CONTENT images are incorrectly classified as AD because such CONTENT images are similar in shape to AD images.
Some LAYOUTER images are incorrectly classified as CONTENT. Large LAYOUTER images with many colors are often classified incorrectly.
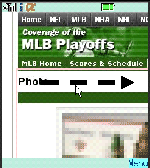
In this section we describe an application that makes good use of our automatic Web image classification method. It is an implementation of a Web page automatic scrolling application that we introduced in sections 1 and 3.
In this application, Web pages designed for desktop PCs are displayed on the screen of a mobile device with the same resolution as the PCs' screen. Thus, while users can browse their familiar pages, only a small portion of a page is displayed on the small screen, and the users have to scroll down the page many times to browse all the information. We believe that automatic scrolling would reduce the user's work load. The automatic scrolling is done by extracting components from a Web page and setting the scrolling path to traverse the extracted components in order. When the user finds interesting information, he or she stops automatic scrolling and browses the information manually at his/her pace.
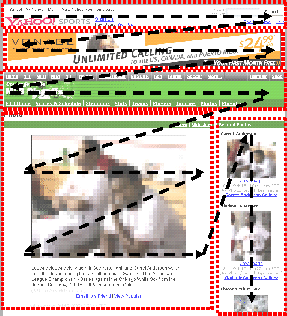
Figure 5 shows the regions of extracted components from Yahoo! Sports (sports.yahoo.com) as dotted frames. In this example, five components are extracted and the scrolling path is set so as to traverse these components in an order shown by the broken line arrows. The paths in horizontally long components are scrolled horizontally, and those in vertically long components are scrolled vertically. As for components with larger height and width such as that at the lower left position, the scrolling paths are set considering the roles given in section 3. Since this component includes a CONTENT image, the path is set to scroll the text over the image, the CONTENT image, and the text below the image in order. If the size of the CONTENT image is larger than that of the screen of the device, the page is zoomed out when the image is scrolled. Here, users can browse downsized CONTENT images without any problem because they seldom include small text characters. In addition, scrolling paths and speeds can be changed depending on the existence of ITEM and AD images.
We implemented this application based on the client/server architecture. The client cellular phones were NTT DoCoMo SH900i-models and the server was a desktop PC equipped with Windows XP. The server extracted components and decided the roles of the images on the Web page that the client requested. Specifically, the server extracted components by using HTML tag analysis and detected the roles of the images by using F1 to F37. The server then merged adjacent components whose sizes were much smaller than the screen size. Finally, the client decided the scrolling paths and speeds based on the information on the extracted components and the roles of the images that it received from the server.
Figure 6 shows a screenshot of our implemented client system, where a component is scrolled in the direction shown by the arrow. Our system surrounded the region of the currently scrolled component with a red colored frame, so that the users would not be confused even when the automatic scrolling was against their intention.
The application provided mechanisms for users to fast-forward and rewind automatic scrolling, skip to the next component, and go back to the previous component simply by selecting a numeric button.
Through the implementation of this system, we confirmed that knowing the roles of images is very useful for implementing a mobile Web browsing application that requires the detailed contexts of the Web page.
The main overhead in image classification is the extraction of
image features. Here, the necessary features depend on the
applications since some applications may only require a few
specific categories. For example, some applications may only
require the detection of string images without
distinguishing their categories, and others may only require the
distinct detection of TITLE and CONTENT images. While our image
classification was in eleven categories, application developers
should carefully choose features that are necessary for their
applications according to the evaluations and statistical factors
of images that we described in the previous sections. In doing
so, the decision tree for image classification also should be
carefully analyzed. (Decision trees used in our experiment are
available from the following URL: http://www-nishio.ist.osaka-u.ac.jp/hresearch/ic/.)
On the other hand, some applications may require more a detailed classification than we provide with eleven categories, e.g., classification of CONTENT images into photographic and drawn images or into images with text and those without text. There are many studies on distinguishing photographic images from drawings [5] that are applicable to our approach. To distinguish images with text from those without text, we can use F36. In this way, by applying new and existing features to the classification results based on the decision tree, more detailed classifications can be created.
The decision as to whether the role of an image is AD or not sometimes depends on the user's viewpoint. For example, an image embedded in a page by the site developer as a CONTENT image may look like an AD image to users. In fact, this situation tends to occur at sites that earn their main income from their services provided at the sites such as shopping or sites that advertise actual services such as those of electronics makers and banks. Since most content on these sites are directly associated with their business or introduce actual services, roughly speaking, all the contents look like advertisements. Therefore, we defined AD images as introduction images created only for directing users to the linked pages. Such images are self-contained by their nature and created for reuse on various pages. For the same reason, these images rarely have neighboring text. Moreover, since these images are only designed for introducing linked pages, the ones on the same page usually have nothing in common with their designs.
Since we used a simple method to get neighboring text, it often occurred that text not related with the images were detected as neighboring text. For example, there are many AD images below text listed as the site menu at the left of the page, and such text is often detected as the neighboring texts of images. In fact, our method is not designed to detect text associated with the image contexts, since our objective is only to detect neighboring text for image classification. However, some applications require pairs of images and their associated text, and for such applications, the associated texts should be extracted after detecting the roles of images.
On the other hand, while there are many studies on image searches that aim to detect text associated with images [12], there is no previous work considering the detailed roles of images.
By improving the accuracy in the basic case (C1), the accuracies in all other cases can be improved. Improving the accuracy of C1 is also a way to broaden the range of executable applications on devices without advanced Web page rendering functions or enough performance for image processing. Our experiments indicated that SECTION images are sometimes tagged with H3 tags. In this paper, we didn't adopt this feature for the sake of generality. However, we plan to use such image features acquired by the HTML source analysis.
In addition, we think that the file names of images may be useful for improving the classification accuracy. For example, since the file names of MENU images on the same page often include common text, e.g., ``menu_news.gif'' and ``menu_map.gif,'' the number of similar file names can be used as a feature for image classification. For this paper, we didn't analyze the text in order to classify images independent of the used languages. However, since the similarity between file names does not have a language problem, the above approach is applicable to our approach.
Detecting the roles of Web images provides various solutions to improve Web browsing activities on mobile devices with a small screen and a poor input interface. We defined eleven image categories according to the roles of the images appearing on the pages. We manually categorized 3,901 images collected from forty sites into the defined categories and extracted 37 image features based on the classification results. By using these features, we devised a method that automatically categorizes images. Our experiments showed that the method achieves 83.1% classification accuracy. We also implemented a Web page automatic scrolling application using the image classification.
As a part of our future work, we plan to examine the CONTENT image classification into more detailed categories for various applications. In addition, we plan to evaluate the effectiveness and the computation cost of our image classification method on a practical platform.
Acknowledgements This research was partially supported by The 21st Century Center of Excellence Program ``New Information Technologies for Building a Networked Symbiotic Environment'' of the Ministry of Education, Culture, Sports, Science and Technology, Japan.
[1] C. R. Anderson, P. Domingos, and D. S. Weld, ``Personalizing web sites for mobile users,'' Proc. World Wide Web Conference (WWW'01), pp. 565-575, May 2001.
[2] T. W. Bickmore and B. N. Schilit, ``Digestor: device-independent access to the world wide web,'' Proc. World Wide Web Conference (WWW6), pp. 655-663, April 1997.
[3] O. de Bruijin, R. Spence, and M. Y. Chong, ``RSVP browser: web browsing on small screen devices,'' Personal and Ubiquitous Computing, vol. 6, issue 4, pp. 245-252, Sept. 2002.
[4] Y. Chen, W. Ma, and H. Zhang, ``Detecting web page structure for adaptive viewing on small form factor devices,'' Proc. World Wide Web Conference (WWW'03), pp. 225-233, May 2003.
[5] C. Frankel, M. J. Swain, and V. Athitsos, ``WebSeer: an image search engine for the world wide web,'' University of Chicago Technical Report, TR96-14, July 1996.
[6] J. Hu and A. Bagga, ``Categorizing images in web document,''IEEE Trans. on Multimedia, vol. 11, issue 1, pp. 22-30, Jan./March 2004.
[7] W. Y. Ma, I. Bedner, G. Chang, A. Kuchinsky, and H. J. Zhang, ``A framework for adaptive content delivery in heterogeneous network environments,'' Proc. SPIE Multimedia Computing and Networking 2000, pp. 86-100, Jan. 2000.
[8] T. Maekawa, T. Hara, and S. Nishio, ``A collaborative web browsing system for multiple mobile users,'' Proc. IEEE Int'l. Conf. on Pervasive Computing and Communications (PerCom 2006), Mar. 2006 to appear.
[9] OPERA Software, ``Opera for mobile,''
http://www.opera.com/products/mobile/.
[10] S. Paek and J. R. Smith, ``Detecting image purpose in world-wide web documents,'' Proc. IS&T/SPIE Symp. Electronic Imaging: Science and Technology Document Recognition, Jan. 1998.
[11] S. J. Perantonis, B. Gatos, and V Maragos, ``Text area identification in web images,'' Proc. Hellenic Conference on AI, pp. 82-92, May 2004.
[12] S. Sclaroff, M. L. Cascia, S. Sethi, and L. Taycher, ``Unifying textual and visual cues for content-based image retrieval on the world wide web,'' Computer Vision and Image Understanding(CVIU), vol. 75(1/2), pp. 86-98, July/Aug. 1999.
[13] WEKA Machine Learning Project, ``WEKA 3,''
http://www.cs.waikato.ac.nz/ ml/weka/.
[14] J. Zhou and D. Lopresti, ``Extracting text from WWW images,'' Proc. Int'l Conference on Document Analysis and Recognition (ICDAR'97), vol. 1, pp. 248-252, Aug. 1997.