Lisa Aminiab, Anees Shaikha, Henning Schulzrinneb
a IBM TJ Watson Research Center
b Columbia University
Copyright is held
by the author/owner(s).
WWW2003, May 20-24, 2003, Budapest, Hungary.
ACM 1-58113-680-3/03/0005.
Internet server selection mechanisms attempt to optimize, subject to a variety of constraints, the distribution of client requests to a geographically and topologically diverse pool of servers. Research on server selection has thus far focused primarily on techniques for choosing a server from a group administered by single entity, like a content distribution network provider. In a federated, multi-provider computing system, however, selection must occur over distributed server sets deployed by the participating providers, without the benefit of the full information available in the single-provider case. Intelligent server set selection algorithms will require a model of the expected performance clients would receive from a candidate server set.
In this paper, we study whether the complex policies and dynamics of intelligent server selection can be effectively modeled in order to predict client performance for server sets. We introduce a novel server set distance metric, and use it in a measurement study of several million server selection transactions to develop simple models of existing server selection schemes. We then evaluate these models in terms of their ability to accurately predict performance for a second, larger set of distributed clients. We show that our models are able to predict performance within 20ms for over 90% of the observed samples. Our analysis demonstrates that although existing deployments use a variety of complex and dynamic server selection criteria, most of which are proprietary, these schemes can be modeled with surprising accuracy.
C.4 [Computer System Organization] Performance of Systems
Performance, Measurement, Reliability.
Content Distribution Network (CDN), performance, Web traffic redirection, server selection.
Internet services and resources are often replicated over geographically and topologically diverse locations to improve performance and availability. In these cases, the problem of server selection naturally arises, in which clients are transparently directed to an optimal server based on specific selection criteria. Much of the recent research into Internet server selection has focused primarily on developing algorithms and mechanisms for redirecting clients [4,5,15,17], or on measuring and evaluating current redirection schemes [6,7,16].
A common feature of these earlier efforts is that they study selection within a group of servers administered by a single entity. Examples include distributed mirrors of a high-volume Web site, or a content distribution network (CDN) with a large number of servers run by a single provider. Increasingly, however, federated, multi-provider computing systems are emerging in which multiple service providers compose distributed sets of servers to increase performance, scale, or capacity.
For example, the IETF Content Distribution Internetworking (CDI) working group [1] seeks to enable interoperability between separately administered CDNs by developing standard interfaces for publishing, distribution, and client redirection. The goal of this effort, also referred to as CDN peering, is to allow individual providers to achieve greater scale and network reach cooperatively than they could otherwise attain individually.
In such a cooperative multi-provider environment, clients are redirected across distributed sets of servers deployed by partnering service providers, in contrast to the single-provider case. Here, a request router must direct requests over sets of servers, as opposed to individual servers belonging to a single provider. The problem is further complicated by the limited information about response time or service cost typically available from individual providers. Service providers will retain load balancing control within their own server sets (much the way Internet routing works between and within domains). Therefore, unlike existing server selection algorithms, an estimate of delay between clients and individual servers is not available. Server set selection algorithms require a model representing the expected performance each candidate server set is likely to deliver to a group of clients.
Developing such a model of traffic redirection, however, is challenging for a number of reasons. The actual server selection criteria used in CDNs are generally considered proprietary information, making it difficult to predict the performance a given client is expected to experience. Since the goal is generally to minimize client response time, the selection criteria may be a complex combination of attributes such as server responsiveness or load, expected network delay, or geographic location. Furthermore, several of the potential attributes vary with time. Also, since there is no single repository listing attributes such as geographic location or expected delay for all Internet-connected systems, the values used in a given scheme are likely to be based on heuristics.
In this paper, our objective is to determine whether the complex policies and dynamics of intelligent server selection can be effectively modeled in order to predict client performance. In particular, we focus on the problem of modeling redirection in geographically and topologically diverse server sets deployed for delivery of Web content. Our work makes the following contributions:
· a novel metric, server set distance (SSD), which we use to simplify the modeling and classification of redirection schemes
· measurement-based methodology in which we analyze over 4.3 million client redirection transactions to produce a taxonomy of schemes used in existing distributed server set deployments
· simple server set redirection models, along with an evaluation of their accuracy based on measurements using a second, non-overlapping set of clients.
The usefulness of our results is not limited to the multi-provider Web content delivery context. The need to intelligently select resources from independently administered infrastructures is the subject of investigation in other applications as well. For example, the scientific community is developing utility-like infrastructures such as the Grid [2] to harness distributed computing power. Also, providers of 3G wireless networks may benefit from the use of dynamic confederations to share bandwidth, processing, and storage resources [3].
The remainder of this paper is organized as follows. In the next section we give a brief overview of common traffic redirection techniques. In Section 3, we present our data collection methodology, and provide an overview of the datasets used in our study. We detail the results of our analysis in Section 4, and offer conclusions in Section 5.
Because traffic redirection for content delivery servers is generally enabled via enhancements to the Domain Name Service (DNS), we begin with a brief overview of DNS. We then describe policies commonly invoked in intelligent DNS-based redirection schemes.
DNS is a distributed database that maps domain names to Internet Protocol (IP) addresses [8]. The domain name space is partitioned into a hierarchy of domains and subdomains so that each domain can be independently administered. DNS servers hold information about a subset of the name space, and pointers leading to information about any part of the name space. Name servers are said to be authoritative for a subdomain, or zone, of the name space if they maintain complete information about that subdomain.
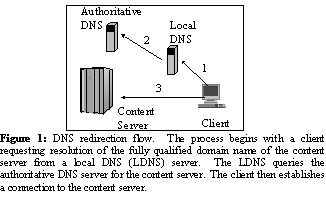
As illustrated in Figure 1, a client typically resolves a fully qualified domain name (FQDN) of a content server by utilizing a client application, called a resolver, to query its local DNS (LDNS) server. The LDNS server queries the authoritative DNS (ADNS) server for the content servers domain, returns the result to the client, and caches the information. If the LDNS receives additional requests to resolve this FQDN before the time-to-live (TTL) specified by the ADNS expires, the LDNS will respond with the cached information.
Websites with stringent performance and availability constraints often replicate content on multiple, geographically distributed servers. In simple load-balancing schemes, the ADNS makes a round-robin or proportional selection amongst the IP addresses of the candidate servers. In more sophisticated schemes, a DNS proxy may intercept ADNS responses and, based on attributes such as server responsiveness or expected network delay, modify the response to enable intelligent server selection.
There are a number of commercially available DNS proxies [13, 14], also referred to as global load balancing switches, with a variety of configurable redirection policies. Examples of supported policies include:
· server responsiveness or available capacity
· round trip time between server and client network
· geographic location of server and client
· least number of requests or connections
· round robin or administrative priority
· client IP address
· time of day
Modeling DNS traffic redirection presents a number of challenges. First, the actual policies used by content delivery service providers are generally considered to be proprietary information, and therefore not publicly disclosed. Any combination of the above policies, or policies specific to the service provider, may be in use. Further, some of the attributes (e.g., server responsiveness) vary with time. Additionally, the client IP address upon which the DNS proxy bases its decision may be the address of the clients agent or LDNS, as opposed to the client itself. Finally, because the LDNS and the client may cache query results, there is not a one-to-one correspondence between DNS responses and client requests arriving at the content server.
The goal of our study was not to determine the effectiveness of any particular scheme, or to evaluate the performance of a given CDN. Instead, our intent was to determine whether the complex policies and dynamics of intelligent server selection could be effectively modeled. We also sought to quantify the accuracy of our proposed models. In the next section, we describe the methodology used to collect data used for this experiment.
Data collection was performed in two phases. In the first phase, we determined a list of target server sets, and a small number of widely distributed clients. We used data collected in the first phase to develop a baseline estimation of the redirection model used by the target server sets. In the second phase, we used the same target server sets, but enlisted a completely different, and more extensive, group of clients. We used data collected in the second phase to assess the accuracy of the baseline model assigned in the first phase. In the following subsections, we detail how server sets were selected, and our measurement methodology.
Our first task was to select a group of server sets for which we would collect traffic redirection data. We used two data sources to create this list. First, we visited the websites of 5 known CDN service providers to retrieve a customer listing. Second, we augmented this list with 25 popular websites using a recognized rating site [11]. We then requested content from each of these websites, specifically seeking content that was being served from a CDN, or from a distributed set of servers.
We were able to determine customer content being served from a CDN by querying the ADNS for the hostnames of website content, and noting responses indicating a canonical name (CNAME) in a CDNs domain. This limits our experiment to server sets using DNS redirection. That is, in this paper, we evaluate server sets in which a server set is defined as the set of IP addresses to which the ADNS maps a particular FQDN. While there are other redirection mechanisms, DNS redirection is the most prevalent among commercial CDN providers.
We also tracked server sets that were not in a CDNs domain, but whose ADNS returned multiple IP addresses for a single FQDN. We utilized the traceroute [6] tool to determine whether the IP addresses in each group were geographically distributed. More precisely, from multiple, geographically distributed systems, we issued traceroutes targeting each of the IP addresses returned by the ADNS. We then inspected the DNS names of intermediate routers discovered by traceroute since a common practice among network service providers is to name routers according to their location. We also verified against the round trip time (RTT) data from the traceroutes, since we issued the traceroutes from systems for which we knew the location.
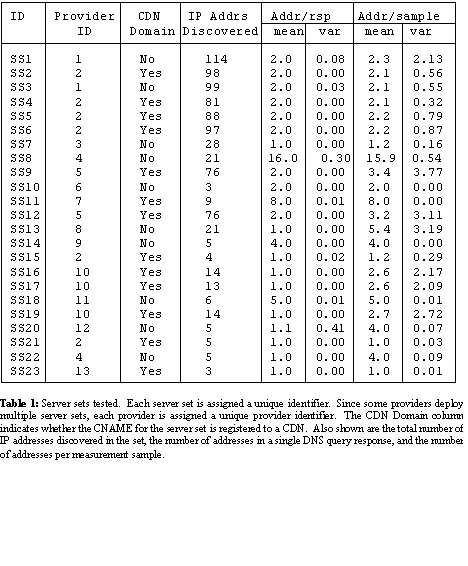
Using these techniques, we compiled a list of 23 server sets believed to be deployed by a CDN or on geographically distributed systems. This list is provided in Table 1. To anonymize this list, we assigned a numeric identifier to each server set. We used the domain part of the DNS name to distinguish between providers and we assigned a provider identifier to illustrate which server sets were deployed by the same provider. It is common for a single CDN to partition its servers into multiple server sets, and host customer content from a single server set. Our target server set list includes examples of such deployments.
There are a number of potential reasons for a provider to partition its servers into multiple sets. For example, partitioning could be used as a coarse-grained form of resource management by assigning fewer customers to one server set versus another. Another possibility is to partition according to capabilities, such as the ability to serve streaming media content. We did not attempt to isolate the exact reason.
However, we were interested in whether CDN providers who partitioned their server sets used the same IP addresses in multiple server sets. In column 4 of Table 1, we provide the total number of servers discovered by methods detailed in Section 3.3. (We defer discussion of columns 5-8 of Table 1 to Section 4.1.)
We found that 174 of the 213 IP addresses discovered in the two server sets deployed by Provider 1 were unique. For Provider 2, we discovered 284 unique IP addresses across their 6 server sets. We also observed an overlap in the server sets deployed by Providers 1 and 2. Namely, only 353 of the 458 IP addresses discovered for these two providers were unique to either Provider 1 or Provider 2. Since Provider 2 is a CDN and Provider 1 is not, we presume Provider 1 is using servers in Provider 2s CDN. For Providers 5 and 10, we discovered 84 and 16 unique IP addresses, respectively. Provider 4 is not a CDN.
Evaluating the actual response time achieved by a particular traffic redirection scheme is beyond the scope of our effort. Instead, we focus on the ability to model, given a particular client IP address, the expected network delay between the client, and the physical server assigned by the individual server set redirection mechanism. We define a novel metric, server set distance (SSD), to characterize the expected delay between a client and a server set. More formally, we define Rik, the SSD between a client i and a server set k as:
![]()
where Nk is the number of servers in server set k. The value aij is the probability that client i, when requesting service from server set k, will be redirected to server j. Depending on the policies established by the entity deploying the server set, this probability may not be constant over time. Finally, dij is the expected round trip time (RTT) in milliseconds between client i and server j. In Section 4, we will detail our observations in using average and minimum RTT to estimate the expected RTT between a client and a server. Next, we describe our measurement methodology.
Baseline measurements were taken over a 33-day period starting in July 2002, and produced two datasets. The first, A1, will establish empirical values for aik, and the second, D1, comprises observed values for dij, where i denotes clients in Table 2 and j denotes servers specified by the ADNS of server sets in Table 1.
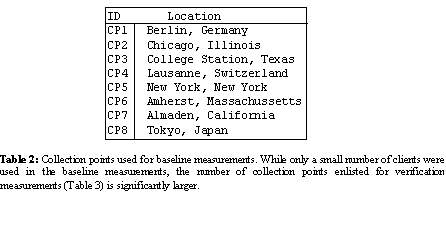
The dataset A1 was collected as follows. A measurement daemon (digd) was installed on a system at each of the client locations listed in Table 2. We refer to these client locations as collection points (CPs). Digd uses the dig [10] tool to collect a single redirection sample by issuing a series of DNS queries to the ADNS of a target server set. DNS queries were sent directly to the ADNS, as opposed to a local DNS server, to avoid receiving information cached by the LDNS. Query invocations within a series were randomly spaced according to a Poisson distribution, with a mean of 2.5 seconds between each query. Each query series lasted 60 seconds, resulting in an average of 24 queries per sample. Digd measurement invocations were also randomly spaced with a mean of 3 hours between measurements to any given server set. Each CP collected samples independently of the other CPs.
The D1 dataset was collected by issuing traceroutes [9] to the IP addresses collected in A1 from each of the CPs. Measurement invocations were randomly spaced with a mean 3 hours between each invocation, but were not synchronized with A1 measurement invocations.
A well-known difficulty with collecting RTT measurements to servers is the practice of blocking or discarding the ICMP messages used by tools such as traceroute and ping. In those cases where traceroute failed to elicit a response from the target server, we used the RTT between the client and the last hop of the traceroute. While our argument for this substitution is not formal, it is based on two observations.
First, administratively blocking undesired traffic is often performed by a firewall at the ingress/egress of a data center. Second, we developed a simple measurement utility, tcprtt, which measures the time to successfully complete a connect request on a TCP socket. Measurements that exceeded the retransimit timeout value employed by TCP (e.g., 3 seconds on Linux implementations) during connection establishment were discarded. We used tcprtt to measure the RTT to the IP addresses for which traceroute failed, from several of the CPs. We compared the minimum connection time measured by tcprtt for these IP addresses, to the minimum RTT to the last hop of a traceroute to the same IP address. We used the minimum times, as opposed to average or median, since we anticipated the TCP connection time is more likely to vary with server load. For the servers we tested, the minimum time to complete the connect request was consistently within 1ms of the minimum RTT observed to the last hop of the traceroute.
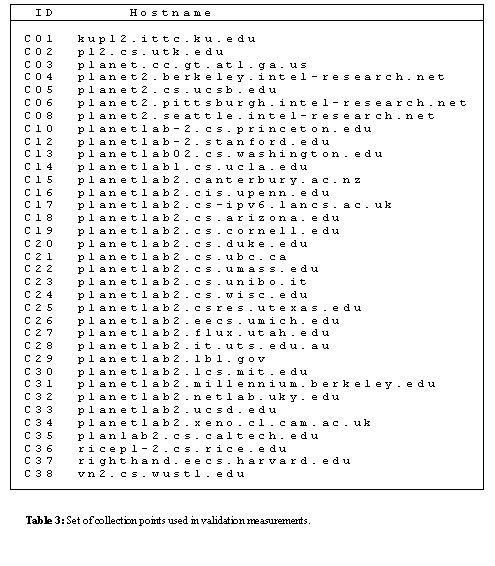
Measurements used in the validation phase of our analysis were taken over a 15-day period starting in October 2002, and produced two datasets, A2 and D2. The same target server sets and measurement techniques employed for A1 were used to capture A2, with the exception that data was collected using the PlanetLab [12] servers listed in Table 3.
The procedure for D2, however, differed from that of D1 in one additional aspect. At the time of our experiment, access to ICMP sockets on the PlanetLab servers was limited to privileged users. For this reason, we used the tcprtt utility to collect RTT observations for D2.
Our first objective was to determine whether we could infer, based on the data in A1 and D1, and the policy information summarized in Section 2.2, a redirection policy for each of the target server sets. After assigning an inferred policy for each server set, the data in A2 and D2 was used to evaluate the accuracy of this assignment across a more extensive set of clients.
Columns 4-8 of Table 1 summarize some coarse-grained attributes for each of the server sets redirection schemes. These statistics provide a number of interesting insights. For example, the number of servers discovered in server sets deployed by CDN providers tended to be greater than those that were not, but this was not strictly the case. Further, by comparing the total servers, and servers per sample, we could broadly classify the sets into two categories: those for which most or all of the sets IP addresses were present in a sample, versus those for which only a small portion of the sets IP addresses were present in a sample.
We were interested in comparing the effect of these attributes on the server set distance observed from the various CPs. We used the data in A1 and D1 to calculate the observed SSD from each CP to each server set. That is, for each sample collected, A1 provides a list of all IP addresses specified by the ADNS in a query response. Thus, for each sample s, we have nj(s), the number of times the IP address j was observed in the sample s, and Nk(s), the total number of IP addresses observed in the corresponding sample. From D1, we established an estimate for dij -- we set d ij to the minimum observed RTT from CP i to the IP address of server j, for each IP address in A1. For each sample, we calculated the observed SSD, R ik(s), as the weighted sum, (nj(s) / Nk(s))* dij, over all servers in the set.
We used these observed SSD values to confirm a number of intuitions. For example, one would expect the SSD observed from a single CP to different server sets to vary. Likewise, one would anticipate the SSD experienced by different CPs when accessing the same server set to vary. In the following paragraphs we quantify this variances.
As illustrated in Figure 2, the observed SSD from a single CP to different server sets varies widely. While plots for only a few of the CPs are shown, the remaining CPs followed this pattern of clear differentiation in SSD values for the target server sets. We also calculated the SSD using the average RTT, as opposed to minimum RTT, for dij. The differences were insignificant.
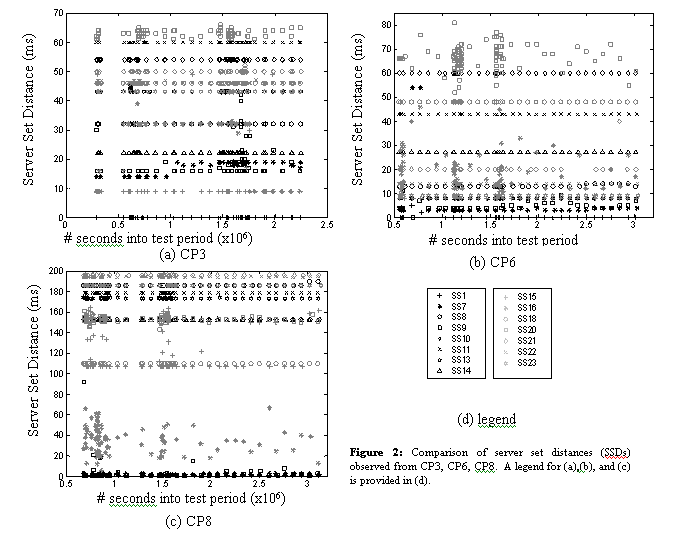
Additionally, we calculated the SSD using only the first IP address listed in any DNS response. In this case, Nk(s) was the number of queries in the sample s, and nj(s) was the number of times IP address j was the first IP address specified by the ADNS in a query response. The purpose of this test was to determine whether LDNS implementations that used only the first IP address in a query response would affect our results. We did not observe any appreciable differences in SSD for this variation either.
Another interesting feature of Figure 2 is that the SSD values between a single server set CP pair were fairly stable over the duration of our test period. This is not surprising since one would expect CDNs to target consistent performance for a given client. However, the SSD did vary over time for some server sets. Consider SS20, which had varying SSD values from all 3 CPs and the most widely varying SSD from CP6. According to Table 1, we discovered only 5 IP addresses for SS20, and the mean number of addresses returned in a single sample was 4. This indicates SS20 may be uniformly distributing client requests across most or all of its servers. The SSD from CP6 and CP8 to SS16 also varied. According to the statistics in Table 1, it is unlikely that SS16 is uniformly distributing client requests over all of its servers. We speculate SS16s redirection policy may consider network congestion or server load, but defer more detailed analysis of SS16s policy to Section 4.3.
We were also interested in knowing whether the SSD of a single server set was consistent across all collection points. In Figure 3, we provide this comparison for 4 of the server sets. Each graph in Figure 3 represents a single server set, and is divided into 8 rows. Each row represents the SSD observed by one of the 8 CPs. The vertical space allocated to each row represents 0-200ms. The intent of this format is to enable visualization of the SSD for a single server set - CP pair over time, and relative comparisons across CPs. For example, in (a) the SSD from CP7 was approximately 10 ms in the initial and final samples, but hovered around 80ms in-between. In (b) the SSD from CP8 to SS11 was consistently about 190ms. These graphs illustrate that the target server sets did not provide uniform SSD values across all of the collection points.
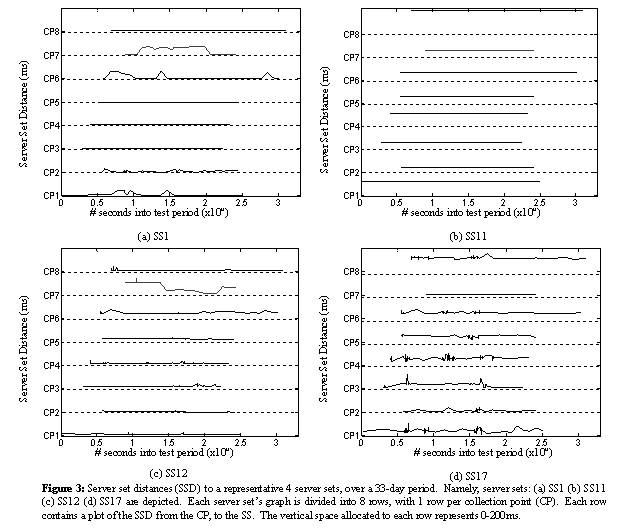
This initial assessment confirmed the SSD of the target server sets was not uniform across all CPs for a single server. We also noted that different server sets achieved better SSD results for certain CPs than for others.
The insights derived in Section 4.1 helped us define a small number of traffic redirection models. For example, Table 1 shows that for several of the server sets, the mean number of addresses per response and the mean number of addresses per sample were equal. This might be indicative of a simple load balancing policy where all of the server addresses for a set were returned on every response, and only the order of these addresses changed on a per response basis. Also, several server sets returned only a single address per response. Intuitively, such a policy would likely attempt to choose the single best address for this client, where best might be defined in terms of expected network delay. A variant could be to load balance over the two addresses expected to provide the minimum delay. Finally, a server selection scheme may intentionally direct a percentage of a clients requests to the server expected to provide minimum delay, but distribute the remaining percentage uniformly across all servers. Such a policy enables an assignment that predominantly conforms to the minimum-delay, while still probing alternate servers
We defined four traffic redirection models as follows.
LBP: under LBP, or load-balanced policy, traffic is uniformly distributed over all servers in the server set.
MIN: traffic is directed to a server with the minimum expected RTT.
MIN2: traffic is uniformly distributed over the 2 servers in the set with the minimum expected RTT. We also tested MIN3, which uniformly distributed clients over the 3 servers with the minimum expected delay, but none of the server sets conformed better to this policy.
WGT: 80% of traffic is directed to the server with the minimum expected RTT. The remaining 20% of traffic is uniformly distributed over all other servers in the set. We explore other distributions for some server sets later.
One might argue that expanding our evaluation to include additional server sets may introduce the need for new models. However, as we will illustrate in subsequent subsections, these four simple models did provide good coverage of the server sets we assessed. Further, we argue that the value of our study is not limited to the assessment of these four models. Instead, we anticipate the methodology used to discover these four models would be useful for discovering and validating new models.
To assign a policy to each server set, we calculated a predicted SSD using each of the above policies and the minimum RTT observed from D1, for each sample. For each CP, we then computed the average predicted SSD, over all samples, for each policy. Thus, for each CP we had the average predicted SSD, under each of the policies, to each of the server sets. We also calculated the average measured SSD from each of the CPs to each of the server sets. We then calculated the mean squared error (MSE) between the average observed SSD and the average predicted SSD, for each of the policies. We averaged these MSE values over all CPs, and refer to this value as the average MSE of the policy.
For each server set, Figure 4 shows the average MSE of the four policies. Since the y-axis of this plot is log-scale, MSE values of 0 were rounded up to 1 so they could be displayed. While the minimum average MSE varied from one server set to another, all server sets except SS7 had at least one policy for which the average MSE was less than 100. That is, each had a policy for which the average difference between the predicted and observed SSD was less than 10ms.
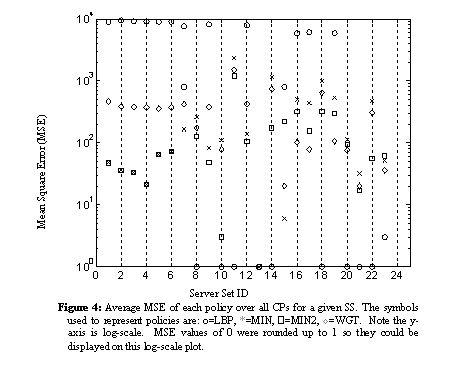
Several servers had equivalent average MSE values for multiple policies. For example, the MIN and MIN2 policies appear to perform equivalently for SS1-SS7. This begs the question, if multiple models result in equivalent average MSE values, would choosing one model in an uninformed manner be good enough? We anticipate it would not, and that having equivalent MSE values is likely to be a side effect of evaluating the policy based on a small number of CPs. In the discussion below, we attempt to resolve which model better represents these server sets. Also, we use a non-overlapping and substantially larger set of CPs to evaluate these assignments in Section 4.4.
For SS1-SS7, which had equivalent average MSE values for MIN and MIN2, we further examined the maximum MSE values. The maximum MSE value for MIN2 was lower than for MIN, for SS1-SS7. Therefore, we assigned the MIN2 policy to SS1-SS7.
The average MSE values for SS13 were equivalent for all four policies, as were the maximum MSE values. Since an overlap between MIN and LBP might be indicative of a server set in which all servers are located within close proximity, we checked the raw data for SS13. We found that while the ADNS for SS13 had resolved SS13 to 21 different IP addresses, there were only 4 different subnets. On closer inspection, we found that all of the IP addresses appeared to be in the New York or Washington DC area. We determined this by issuing traceroute commands to the IP addresses and inspecting the RTT times and DNS names of intermediate routers, as described in Section 3.1. Further, an inspection of the queries in A1 indicated SS13s ADNS primarily directed CPs to a single subnet, regardless of the location, but in some cases would load balance over the various other subnets. We classified SS13 as LBP.
For SS16, SS17 and SS19, the average MSE values for the WGT policy were lower than for the other policies. However, the average MSE values for WGT were higher than for policies selected for other server sets. We experimented by varying the weight assigned the server with the minimum RTT, versus the remaining servers in the set. We also tested variations that uniformly distributed a percentage of the traffic over the 2 servers with the minimum RTT, and uniformly distributed the remaining percentage over the other servers in the set. We were unable to find a policy that achieved a better average MSE value. Likewise, the MIN policy achieved the best results for SS7, but was higher than the minimum average MSE values for other server sets. The average difference between the observed SSD and the SSD predicted by the MIN policy for SS7 was approximately 13ms.
To gain insights into this issue, we plotted the minimum MSE values for each server set, on a per CP basis. This plot is provided in Figure 5. Note that each graph in Figure 5 represents only the MSE values for the policies selected for each server set. For example, (a) contains those server sets assigned the LBP policy, namely SS8, SS10, SS11, SS13, SS14, SS18, and SS20-23. Graph (b) depicts server sets assigned the MIN2 policy. Server sets assigned the remaining policies, WGT and MIN, are shown in (c).
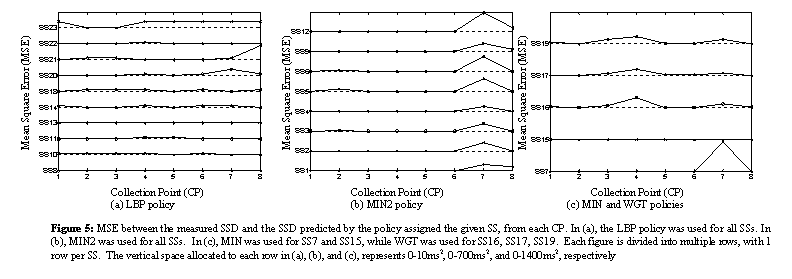
A prominent feature of Figure 5 is the large MSE observed at CP7, for all of the server sets classified as MIN2 and for SS7. We inspected the raw data for CP7 and found that, although CP7 is located in California, it was frequently directed to servers in the New York area.
There could be several reasons why a given redirection policy would result in sending most clients to servers with low minimum RTT values, but not doing so for other clients. For example, the server with the minimum RTT value might be persistently overloaded. Or, a more likely scenario is the redirection mechanism might be incorrectly evaluating the location of the client. Also, the redirection mechanism may base its proximity evaluation on metrics other than observed RTT such as the estimated geographic location of the client. It is interesting to note that CP7s IP address is allocated from a Class A address block, known to be distributed across the US. The ARIN routing registry [18] entry lists New York as the location for this Class A address block.
Since the issue with the MIN policy for SS7 appeared to be localized to CP7, we did not change its MIN classification. The issues with the WGT policy for SS16, SS17, and SS19 also appear to be dependent on the collection point, with CP4 showing the largest deviation. We did not reclassify the WGT server sets.
Figure 5 (a) also indicates a potential issue with the LBP policy for SS21. We inspected the raw data for SS21 and found that it actually did not conform to the LBP policy. This server set had the unusual characteristic that nearly all samples were identical, regardless of the CP from which they were collected. More specifically, all CPs were directed to a single IP address for over 97% of the samples. In rare instances, the ADNS would direct a CP to different IP address, but return to the predominant IP address for the next sample. Similar behavior was also observed for another server set deployed by the same provider, SS15. SS15 had been classified as MIN. Both SS21 and SS15 achieved the best MSE using a model that simply directed all requests to a single IP address.
For this portion of our analysis, we relied on the A2 and D2 data sets. Our goal was to evaluate whether our model assignment would hold for a different time period, and for a completely different, and larger set of collection points.
We began our evaluation by calculating the observed SSD, Rik(s), and the SSD predicted by the assigned model, pik(s), for each sample in A2. The SSD values are calculated as described in Sections 4.1 and 4.2, but using data from A2 and D2. For each sample, we then calculated the sample prediction error eik(s) as:
![]()
The cumulative distributions of the sample prediction errors for each server set are plotted in Figure 6. The distributions represent all samples, taken from all of the collection points listed in Table 3. All of the server sets had prediction errors of less than 20 ms for over 90% of the samples, with SS7 performing the worst. In SS7, 9% of the samples had prediction errors of 20 ms or more. Upon closer inspection, we noted that all of the samples with prediction errors of 10ms or more were localized to 5 collection points. An examination of the raw data indicated that C04 and C08 were both consistently directed to hosts in the Chicago area. C04 is located in the San Jose area; C08 is located in the Seattle area. Other collection points proximal with C04 and C08 were directed to San Jose and Seattle areas, respectively.
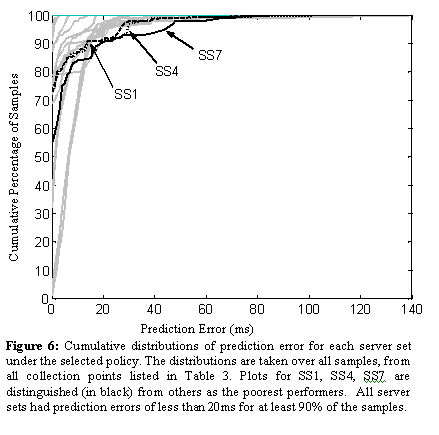
We also note from Figure 6 that 8% of the samples for SS1 and SS4 had a prediction error of 20ms or more. Similarly to SS7, all of the samples with a prediction error of 10ms or more were limited to originating from 4 and 5 collection points for SS4 and SS1, respectively.
In Section 4.3, we listed several potential causes for a given redirection scheme to send most clients to servers with low minimum RTT values, but not do so for other clients. We wished to gain insights into which were the most likely issues for our target server sets. A consistently high prediction error across the majority of samples from a given CP is more likely to be caused by an incorrect evaluation of the clients location. Conversely, a widely varying prediction error is more likely indicative of a redirection scheme using dynamic metrics, such as server load.
In Figure 7, we plot the individual SSDs, both observed and predicted, for those collection points that registered a prediction error of 10ms or more on at least 1 sample. That is, Figure 7 includes only the server set collection point pairs that achieved the poorest prediction results. To be precise, only the server sets with the highest percentage (8-9%) of samples with prediction errors of 20ms or more, and only the collection points that had at least one sample with a prediction error of 10 ms or more to these server sets are represented.
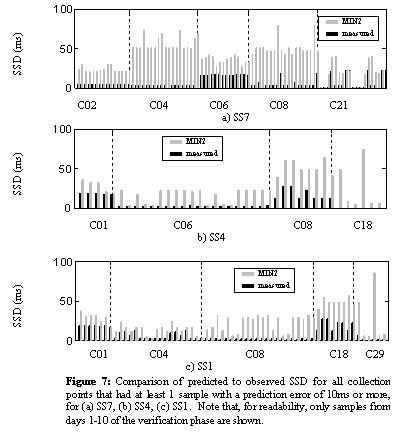
For C01, C02, C04, C06, and C08, the majority of the samples suffered from a relatively consistent error between the measured and predicted SSD values indicative of an incorrect evaluation of the clients location. However, the measured SSD, as well as the prediction error, for C18, C21 and C29 varied more widely. This behavior is more characteristic of a redirection scheme compensating for issues such as server overload. In future work, we intend to investigate methods to better model these behaviors.
In this paper, we have proposed an innovative approach to modeling the redirection of traffic in geographically diverse server sets. We defined a novel metric, server set distance (SSD), to simplify the process of classifying redirection schemes. We presented our measurement methodology and an analysis of over 4.3 million redirection transactions.
Our analysis demonstrates that, although existing deployments factor in dynamic attributes, such as expected network delay and server load, these schemes can be modeled with surprising accuracy. All of our model assignments achieved a prediction error of 20ms or less for over 90% of the samples. For 52% of the model assignments, 100% of the predicted SSDs across all samples, from all collection points were within 25ms of the actual measured SSD. Additionally, 29% of the model assignments predicted 100% of the sample SSDs within 10ms of the measured SSD, again across all collection points and samples.
Our model provides a foundation for intelligent selection over multiple, separately-administered server pools. Consider, for example, the CDI scenario described in Section 1. A Web hosting or CDN service provider seeks to achieve scalability, resiliency, or network delay objectives by offloading content delivery requests to partners. This provider might deploy a base infrastructure and, under conditions such as a load surge, data center failure, or unexpected demand from distant geographic regions, direct client requests to one or more partners. Since the partners retain load-balancing control within their own server sets, the provider requires algorithms to intelligently select amongst the sets of servers, as opposed to individual servers. Instead of requiring each partner to specify how individual clients would be serviced, our server set models could be used to determine the expected performance that groups of clients would experience from various partners. Our model-based approach is important since having each partner communicate how it would service millions of potential web clients would introduce significant scalability issues, and requesting this information from each partner at client request time would introduce substantial delays.
The value of such techniques is not limited to the CDN context in which we have performed our analysis. Federated, multi-provider computing systems are also sought for other applications, including Grid and 3G wireless deployments. Our methodology can be applied in these scenarios to develop models for predicting client performance.
We thank Pascal Frossard, Jim Kurose, Tak Kushida, Jiri Kuthan, Dharshan Rangegowda, and Renu Tewari for assisting us with baseline measurements. We also thank Andrew Campbell, Stephen Chou, Brent Chun, and the rest of the PlanetLab team for access to PlanetLab servers. Finally, we are grateful to the anonymous reviewers for their useful and extensive feedback.
[1] M. Day, B. Cain, G. Tomlinson, P. Rzewski, A Model for Content Internetworking, Work in Progress, http://www.ietf.org/internet-drafts/draft-ietf-cdi-model-02.txt, May 2002.
[2] I. Foster, C. Kesselman, S. Teucke, The Anatomy of the Grid, International Journal of Supercomputer Applications, November 2001.
[3] R. Katz, A. Joseph, "A Revolutionary Confederated Service Architecture for Future Telecommunications Systems," University of California MICRO Research Proposal, March 2001. http://www.cs.berkeley.edu/~randy/proposals/micro01.pdf.
[4] S. Bhattacharjee, Z. Fei, "A Novel Server Selection Technique for Improving the Response Time of a Replicated Service," Proceedings of IEEE Infocom, March/April 1998.
[5] M. Crovella and R. Carter, "Dynamic Server Selection in the Internet," Proceedings of the Third IEEE Workshop on the Architecture and Implementation of High Performance Communication Subsystems (HPCS'95), August 1995.
[6] A. Shaikh, R. Tewari, M. Agrawal. On the Effectiveness of DNS-based Server Selection, Proceedings of IEEE Infocom, 2001.
[7] Z. Mao, C. Cranor, F. Douglis, M. Rabinovich, O. Spatscheck, J. Wang, A Precise and Efficient Evaluation of the Proximity between Web Clients and their Local DNS Servers, Proceedings of Usenix Annual Technical Conference, June 2001.
[8] P. Albitz, C. Liu, DNS and BIND, OReilly and Associates, 1998.
[9] V. Jacobson, Traceroute software, ftp://ftp.ee.lbl.gov/traceroute.tar.gz, 1989.
[10] Internet Software Consortium, http://www.isc.org/products/BIND.
[11] Hot100. http://www.100hot.com
[12] Planetlab, http://www.planet-lab.org.
[13] IBM Corporation, WebSphere Edge Server for Multiplatforms: Network Dispatcher Administration Guide, Version 2.0, September 2001.
[14] Foundry Networks, Foundry ServerIron Switch Installation and Configuration Guide, June 2002.
[15] L. Wang, V. Pai, L. Peterson, The Effectiveness of Request Redirection on CDN Robustness, to appear in Proceedings of Fifth Symposium on Operating Systems Design and Implementation (OSDI02), December 2002.
[16] B. Krishnamurthy, C. Wills, Y. Zhang, "On the Use and Performance of Content Distribution Networks," Proceedings of ACM SIGCOMM Internet Measurement Workshop (IMW'2001), November 2001.
[17] K. Hanna, N. Natarajan, and B. Levine, "Evaluation of a Novel Two-Step Server Selection Metric," Proceedings of IEEE International Conference on Network Protocols (ICNP 2001), November 2001.
[18] American Registry for Internet Numbers (ARIN). http://www.arin.net.