Figure 1. An example of Web interactions
The Web has enabled a range of Web interactions from the downloading or exchanging of resources including media streams to conducting business tasks over the Internet, Intranet, or Extranet. With the emergence of Web services [1], the Web interactions and the corresponding Web traffic are becoming ever dynamic. Compared to other distributed systems, the Web has several characteristics. First, it is the largest and most complex distributed system. The Web can be accessed from almost everywhere in the world. It contains the largest number of nodes, each of which is in the form of an end user, client, server, or other intermediate server, proxy, gateway, etc. Second, the patterns of Web traffic are dynamic. Each node can potentially interact with any other node directly or indirectly, by exchanging messages, while a single task/request can induce a set of interactions spanning across a hierarchy of nodes. Third, traffic volume on the Web (e.g., the traffic directed to a travel Web site) can be extremely dynamic, sometimes unpredictable. Fourth, the Web is unreliable and insecure. Any node and/or link failures, or malicious attacks could potentially make some services inaccessible or malfunction. The above factors indicate a great degree of Web complexity, and the management of Web complexity is becoming critical to the continuing success of the Web.
One integral component of a Web services management solution is the measurement and monitoring of Web traffic. It requires collecting and correlating different types of measurement data at different levels. From the client's perspective, e.g., end-user or ISP, it would like to characterize their interactions with the servers by addressing, for example, the following questions: What paths does a type of Web traffic take to reach the service provider? What is the average response time and volume for each type of traffic, as well as its breakdowns at each segment of its path to the server? What is the average failure rate for each type of traffic? From the server's perspective, it, besides the above information, would like to characterize their reactions to the service requests by addressing, for example, the following questions: What processing paths/chains does it take for each type of service request? What are the traffic statistics end-to-end as well as its breakdown at each segment of a processing path?
As an example illustrated in Figure 1, a client sends a service request to and receives a response from a service provider. After receiving the request, the application server interacts with its internal components that, before sending back the response, interact with a sub service provider across the enterprise domain. To enable efficient manageability, not only the traffic is observed from the client's perspective, but also it is desirable to break down the measurements (e.g., response time) at participating internal and external components.
Figure 1. An example of Web interactions
The above issues impose two requirements on the traffic monitoring for Web services. First, the monitoring should be done at multiple levels: network, transport, application, and transaction layers. Second, the traffic associated with a multi-tier transaction, as depicted in Figure 1, should be correlated such that breakdown analysis can be realized from either service consumer or provider's perspective.
We propose in this paper an approach called WTM that
fulfills the above requirements. We organize the remainder of the paper in the
following. In section 2 we outline the existing approaches for Web measurement.
In section 3 we briefly describe the WTM components. In section 4 we describe
our distributed measurement and correlation protocols. In section 5 we discuss
the design and implementation issues and present the architecture of WTM. In
section 6, we present the simulation results. We draw the conclusion in section
7.
The existing approaches to Web measurement can be
classified into four categories: Web logging, packet monitoring, active
measurement, and instrumentation and interception. Each type of approach with
different focus in mind targets some levels of information at certain
granularity.
Web logging [2], as part
of request handling, can be generated by Web software components such as servers,
proxies, and browsers. Statistics derived from server logs provide valuable
information to the site administrator and content developers. For example,
a server log could be used to analyze user access patterns and relative
popularity of the resources at a Web site. On the other hand, browser logging enables
the characterizing of user browsing patterns. Depending upon where the proxy
sits, the proxy log collects the above information from the perspective of a set
of servers or clients. While having played a key role in Web measurement,
logging-based approaches have the following limitations: they cannot provide any
statistics at network and transaction levels, e.g., the response time of a Web
transaction. In addition, the logging is usually done by some software component
such as Web server, which imposes non-trivial overhead.
In contrast to logging, packet monitoring [2], by capturing
copies of packets on network links, collect information at network levels: e.g.,
TCP/IP. By
reconstructing application-level messages, e.g., HTTP messages when possible,
packet monitoring can also capture the statistics at the application protocol
and transaction levels. One easy observation is that it would impose significant
performance impacts on the monitored network links if each packet were captured.
To reduce the overhead, some sampling-based approaches [3] have been proposed to
select a portion of packets to be monitored. The sampling techniques should be
designed such that the sampled subset is not statistically biased in any way.
While being one of the most effective types of approaches to Web measurement,
the existing sampling-based solutions do not aim to address the correlation of
traffic associated with multi-tier Web transactions, therefore they do not
enable traffic breakdown on the participating tiers.
To measure Web performance from end-user's perspective or to decompose the various components of delay, an alternative approach, referred to as active measurement, is to generate or simulate requests from measurement agents. The agents send requests from different geographic locations through different access bandwidth at specified time intervals. While it is an effective technique for studying user performance, this type of approach cannot collect volume information of Web traffic. More importantly, it does not work well for the monitoring of dynamic Web transactions. According to some existing solutions [4], measurement agents send simulating requests by following the logical steps of a transaction (e.g., placing an order to Amazon.com). This presents several drawbacks: The measurement agent has to understand and remember the logical steps associated with each type of transaction to be monitored, and it is invasive, burdensome, and application-dependent. In addition, the measurement may not be accurate as a simulating request, compared to a real one, may induce a different execution path, thus the traffic analysis, especially inside the firewalls of Web servers could be of little use.
One important aspect of managing Web complexity is to understand the behaviors of multi-tier dynamic Web transactions and characterize the interactions in the dynamic transaction networks over the Internet. To achieve this, the traffic associated with multi-tier Web transactions need be correlated in some manner. One way to enable correlation is to instrument applications with some measurement APIs (e.g., Application Response Measurement, ARM [5, 6]) such that a correlator can be generated and passed onto each component of a multi-tier transaction. Instead of invasive instrumentation, an alternative approach is to, from user's perspective, non-invasively intercept the messages exchanged between components. This usually involves filtering or interception at the middleware level (e.g., CORBA, SOAP). The non-invasiveness is achieved at the expense of losing the correlation capability. While this type of approach is most useful to collect statistics at the transaction level, it has several limitations: impractical or difficult approach to correlation, and lack of statistics at network levels.
Compared to the existing Web management solutions, our
approach aims for the management of multi-tier Web service transactions. It has
one unique feature: while the monitoring of Web traffic is done at multiple
levels: network, transport, application, and transaction layers, the traffic
associated with multi-tier transactions can be correlated non-intrusively such
that breakdown analysis can be realized from either service consumer or
provider's perspective. To achieve these, a combination of sampling-based packet
monitoring and packet probing is used to collect measurement data. A causal
sampling protocol is designed to synchronize and correlate the capturing of the
traffic associated with multi-tier Web transactions.
We assume the following about the Web entities and their interactions.
WTM is designed to monitor Web traffic from the perspective of a Web entity, and break it down at relevant components. For example, Figure 2 illustrates an e-commerce scenario where an end user goes shopping through a SmartBuy online service. The SmartBuy service in turn acquires merchandise from different suppliers through Ariba's brokering service. In this scenario, WTM enables two levels of observations: entity and global levels. The entity-level monitoring, where applicable, observes ingress traffic and correlates it with the corresponding internal traffic (inside the entity) and egress traffic to remote entities. The global level integrates and correlates statistics from the entity levels, and draws a global view of Web interactions relative to original service requests. The global level monitoring is optional, and feasible only if the participating entities are willing to reveal their measurement data. It may not be likely in reality due to security reasons.
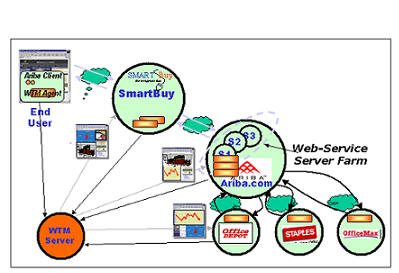
Figure 2. A monitored Web transaction network
The WTM framework
consists of the following components, and the implementation issues will be
discussed in section 5.
·
Packet sampler is a device that samples, based on the
causal sampling protocol, a copy of packets from/to a monitored host.
·
Entity agent/server is a software component that performs
the causal sampling protocol, receives packets from the sampler, reconstructs
higher-level streams or messages, and performs the entity-level measurement.
·
Global server is a software component that, if permitted,
is configured to retrieve measurement data from a set of collaborating entity
servers, and performs the global-level integration and correlation.
Before describing the protocol, we briefly discuss the techniques we use to make the sampling decision. As some efficient techniques [3, 7] have been proposed, we can simply try to leverage them for our purpose. There are basically two types of techniques: hashing and threshold, which are orthogonal to the protocol itself. The first is to execute a selection (e.g., hashing) function over a set of header fields, whose result is then used to make the sampling decision. The second type of technique is based on the following idea. A certain percentage can be configured dynamically such that at most this percentage of traffic relative to a Web entity should be sampled. Our causal sampling protocol can work with either of the strategies.
Figure 3. A communication scenario
Due to different
objectives, WTM faces some fundamentally different issues that need be addressed
accordingly. First, traffic need be observed at multiple levels, instead of IP
level only. If a packet is sampled, the rest of the packets associated with the
same application-level message (e.g., an HTTP request) should also be
sampled. Furthermore, each packet associated with the corresponding response
message (e.g., an HTTP response) should be sampled so that the transaction-level
statistics can be collected.
Second, traffic associated with multi-tier transactions need be correlated so that breakdown analysis can be realized. As depicted in Figure 3, we suppose that request-response pair m0 and m7 induces two sequential interactions between C0 and C1 and one interaction between C0 and C2. If m0 and m7 are sampled, so should m1, m3, m4, m6, m2, and m5 . This presents a great challenge: the packets at different tiers are essentially unrelated, and the correlation is impossible unless the causal relationships between the packets are known. Further, concurrent messages make the correlation an even harder task. For instance, suppose we know that an incoming message of type A would cause an outgoing message of type B. When, in a concurrent situation, there are multiple incoming messages of type A and multiple outgoing messages of type B, it is desirable but difficult to correlate an incoming message with the outgoing one it induces. As illustrated in Figure 4, if one of the three concurrent requests received by C0 is sampled, it would be desirable if the interactions among C0, C1, and C2 that are caused and only caused by the sampled request can be captured as well (we will describe, following the description of the causal sampling protocol, how to deal with the scenario in Figure 4).
Figure 4. A concurrent sampling scenario
The objective and unique virtue
of the WTM
design is to non-invasively monitor multi-tier Web transactions and efficiently
deal with the issues demonstrated in Figures 3 and 4. To achieve this, we
propose an approach that coordinates the distributed sampling from a Web
entity's perspective. The approach consists of several components: the
conversation table, the correlation table, and the causal sampling
protocol.
Table 1. The conversation table
| Service/Operation | Component 1 | ... | Component n |
|---|---|---|---|
| Entry 1 | http::url::port | ... | other::procName |
| ... | ... | ... | ... |
| Entry m | soap::url::port | ... | other::procName |
A Web entity maintains a conversation
table. The table contains an entry for each service/operation pair exported by
the entity, as presented by Table 1. If a service/operation pair involves
interactions with some remote components, its entry keeps a list of the
collaborating components. A component can be either an external Web entity or a
remote component inside the same Web entity. Depending upon the underlying
application-level protocol (e.g., HTTP or CORBA/IIOP), a component is presented
by either a complete URL/port string or simply the process name of the remote
application. Note that the above information is usually available at the time of
system installation or deployment. Thus little invasiveness is
involved.
Table 2. The correlation table
| Service/Operation | Component 1 | ... | Component n |
|---|---|---|---|
| Entry 1 | http::ip::port::script | ... | other::ip::port |
| ... | ... | ... | ... |
| Entry m | soap::ip::port::script | ... | other::ip::port |
To be
used by packet sampler, the conversation table needs to be mapped into the correlation
table during runtime. As described in Table 2, each component is represented
by its protocol, IP address and port number. For an HTTP-based component,
additional "script" field is used to identify the service request: an html file
or a service/operation pair.
The sampling protocol consists of two parts: the coordinator and the workers. A Web entity that receives service requests from remote entities acts as the coordinator. It synchronizes the distributed sampling of packets from/to the collaborating components that act as the workers.
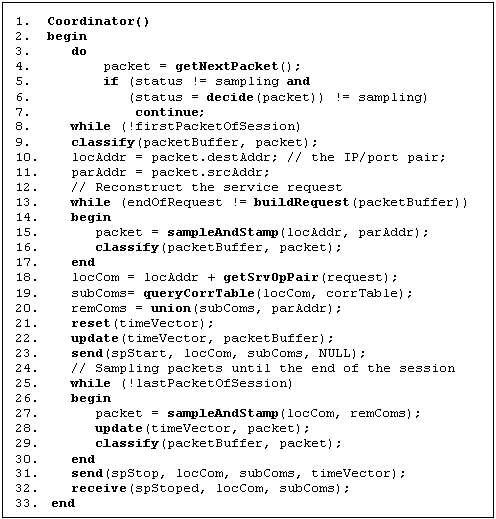
Figure 5. The coordinator of causal sampling
Figures 5 and 6
present the skeleton of the protocol. One of the key data structures used is TimeVector. During sampling, each component maintains a
TimeVector that records the numbers of packets (logical timestamps) it sends and
receives. For component Ci, its vector is defined as Ti= (ti,0,
ti,1, ..., ti,n) where ti,j in the
vector represents Ci's observation on the number of
packets sampled on component Cj participating in the
multi-tier transaction. When sampling a
packet, Ci increments Ti.ti,i by one. When
sampling an outgoing packet, Ci tags
Ti.ti,i on the packet, and sets the packet's local
stamp to Ti.ti,i. When sampling an incoming packet from Cj,
Ci sets Ti.ti,j to the tagged timestamp,
i.e., Tj.tj,j, and sets the packet's local and remote
stamps to Ti.ti,i and Ti.ti,j respectively.
For example, Figure 3 presents a scenario where C0, after receiving request m0, interacts with C1 and C2. To simplify the discussion, suppose that each message is contained in a single packet. When response m7 is sent back, the values in T0, T1, and T2 should be calculated as: T0 = (8, 4, 2), T1 = (5, 4, 0), T2 = (2, 0, 2).
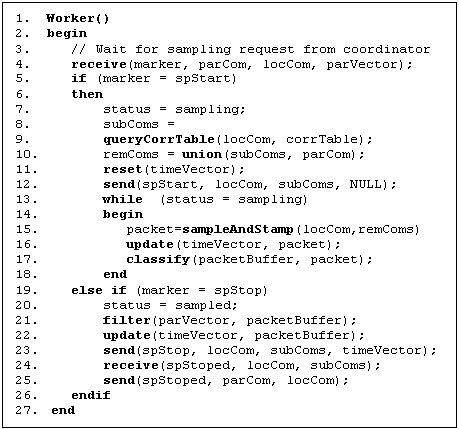
Figure 6. A worker of causal sampling
According to
the algorithm in Figure 5, the coordinator works as follows.
·
When a sampling decision is made, waits for the first
packet of a new session with a client, and initiates a new round of
sampling.
·
Samples and time-stamps, based on the pairs of IP addresses
and port numbers, the incoming packets until the corresponding request message
is retrieved.
·
Retrieves the service/operation pair from the request, and
looks up the correlation table for the subcomponents to be interacted.
·
Resets and updates the local time vector according to the
packets sampled.
·
Sends its sub components the marker messages that flush the
communication channels, and informs the start of the distributed sampling.
·
Samples a packet if it is from or to the interacted
subcomponents or the requesting client, then updates the local time vector.
·
Until the last packet of the current session is sampled,
repeats the previous step.
·
Sends its subcomponents the marker messages that flush the
communication channels, and inform the end of distributed sampling. The marker
is tagged with the local time vector.
· Receives from its subcomponents that the sampling on each subcomponent has finished.
According to
the algorithm in Figure 6, the workers perform the following.
·
Listen to the coordinator/parent for marker message.
·
If the marker is a "start", sets its local status to
"sampling".
·
If the local status is "sampling", looks up its
subcomponents to be interacted, resets its local time vector, and forwards the
marker to its sub components if any.
·
While the local status is "sampling", samples a packet if
it is from or to its subcomponents or parent, then updates its local time
vector.
·
If the marker is a "stop", sets its local status to
"sampled".
·
Filters the sampled packets such that, if its local stamp
is greater than the corresponding element of the parent's time vector, the
packet is discarded, as well as all other packets associated with the
same inter-component interaction.
·
Updates the local time vector according to the filtered
packets.
·
Forwards the "stop" marker to its subcomponents if any. The
marker is tagged with the local time vector.
·
Receives from its subcomponents that the sampling on each
subcomponent has finished.
·
Sends its parent an acknowledgment indicating that the
local sampling is done.
In the concurrent scenario, it is possible that a component samples packets that are not associated with the same inter-component interaction. Let us explain this by an example illustrated in Figure 4. Suppose that a three-tier Web service simultaneously receives three requests from three different clients, and one request/response pair (a transaction) is sampled. Again to simplify the discussion, we assume that each message is contained in a single packet, and a request/response pair induces a round of message passing across the three tiers. According to the protocol, only part of the messages sampled at the second and the third tiers are associated with the sampled request/response pair, and the rest are associated with the other two. However, it is usually impossible to distinguish the two parts. Thus, instead of doing one-on-one correlation, WTM performs group correlation as follows. First, the volume of the traffic observed is used to infer the volume for a type of transaction. In this example, we can infer that during sampling period there are at least three requests for the service, two of which have been processed at the end of the sampling cycle. Second, the statistics of the group of concurrent transactions (e.g., there are two concurrent transactions in Figure 4) is represented by that of the sampled and kept traffic (e.g., the solid lines in Figure 4). The statistics can be aggregated using various methods such as max, min, average, distribution, etc.
With the causal sampling protocol, the processing paths for each type of service request can be drawn while the traffic statistics can be broken down at the participating components on the paths.
As described before, another requirement of Web traffic monitoring is to enable end-to-end observation and breakdown from service consumer's perspective. An example would be an end user, an ISP, or a Web service would like to understand the network paths its service requests take to reach its service providers while decomposing traffic statistics at various network components of a path, e.g., proxies, gateways, etc. To achieve this, there are basically the following approaches: link measurements [8], flow aggregation [9, 10], trajectory sampling [3], and end-to-end probing [11-14]. As the first three types of approaches require dedicated measurement support from networks, WTM uses the following approach based on the end-to-end probing technique. When sampling an inter-domain message, the local entity sends the destination IP address a probing message with the same size. The sending of the message is done by manipulating the TTL value in the IP packets. That is, the probing is repeated with an incremented TTL value until the returned ICMP message indicates that the probing message has reached the destination. Suppose that Si represents the statistics of the ith probing and the total number of probing is n. Then we use Sn to estimate the statistics of the network path (e.g., delay, packet loss rate, etc), and (Si - Si-1) for the statistics breakdown on the network segment between network components Ni-1 and Ni.
The issues regarding WTM's
implementation mainly remain in two areas: the design of packet sampler, and
the splitting of causal sampling between sampling device and entity agent and
adaptation of the causal sampling protocol to the sampler's design scheme.
The first issue is about how to tap
network links and get a copy of packets. In other words, how and where should
we implement the sampler's logic? Generally speaking, there are three types of
solutions: software sampler, dedicated sampling/monitoring computer, and
sampling ASIC [15]. For software-based approach, the sampler is implemented in
the form of a software module. It leverages the filtering, chaining, or other
hooking facilities, provided by some distributed or Web computing platforms
[16-19], to develop filters, sinks, or chain handlers to intercept messages for
security, reliability, or manageability purpose. While it does not require
hardware support, software sampler suffers the several drawbacks: 1) messages
are monitored only at the application level, so that no network-level
statistics is available; 2) the solution is platform-dependent. Different
platforms or middleware require different interception implementations, such as
ISAPI filters [20], Axis chain handlers [21], .NET sink chains [22], etc. Plus,
not every type of platform (e.g., sockets) provides the necessary hooks; 3) the
software sampler, usually as a shared library running in the same address space
of the monitored process, involves non-trivial overhead such that it can often
become the performance bottleneck itself.
An alternative to software sampler is to deploy dedicated machines as samplers, and attach them to the monitored network. As described in Figure 7 [2], the sampler, depending upon the underlying network technology and configuration, can be attached to the network and tap the links in different ways. The potential issue with this approach is that it may not scale as the network size gets larger and the topology gets more complex.
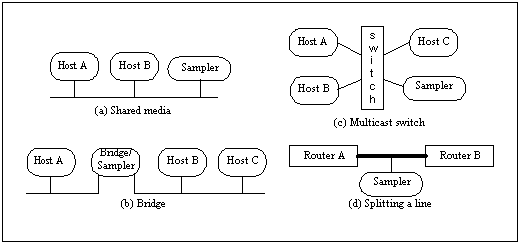
Figure 7. Techniques for tapping a link
There is a trend over recent years to move processing power
and functionality (e.g., packet classification) to the interfaces [3, 23]. As
demonstrated by such systems [3, 23], adding measurement and/or security
support to interface cards is not only feasible, but also critical for
achieving wire-speed performance, lower cost, and lower power. The logic of
measurement or other management functions is embedded in an ASIC chip that is
then added to a NIC. To maximize the performance and minimize the cost, WTM
chooses the ASIC-based solution, and adds the logic of the sampler to an ASIC
chip. The sampling ASIC presents a scalable approach to packet collection as
its deployment does not depend upon the underlying network technology and
configuration. That is, a sampling-enabled interface card can simply replace a
standard NIC and be installed on any node that is to be managed.
The next issue we face is to decide what portion of the casual sampling protocol should/can be embedded in the sampling ASIC. Based on state of the art in the ASIC technology, it is impractical to implement the whole protocol in an ASIC chip. Instead, WTM splits the causal sampling between the ASIC and the entity agent, i.e., the middle-tier software component. According to the design, the packet sampler implements the following logic: a) on the coordinator site, making a sampling decision by executing the sampling selection function, and identifying next session/connection to be monitored; b) recording the local and remote IP/port pairs through which the packets need be sampled; c) sampling a packet if its source/destination addresses are matched against the recorded ones; and d) forwarding the sampled packet to the local entity agent.
According to the logic of the sampling device, we can see
that a large of portion of the protocol would have to be implemented in the
entity agent, such as packet filtering and stamping, the manipulation of time
vectors, and the synchronization of sampling between parent, local, and sub
components, etc. Also the protocol has to be modified to adapt to this specific
implementation, and we add or modify the following items: a) the marker
messages are exchanged using a dedicated port so as to be recognized by the
samplers; b) the markers are tagged with the local and remote IP/port pairs
such that the samplers can remember them and decide whether a passing packet
should be collected; and c) replaces the scheme of tagging IP packets with the
packet sequence counter (from the time vector).
The first two items are straightforward, and let us discuss the third item in detail. As we do not want to change the existing logic of a network interface card, it would be impossible to tag packets with the counter information. Therefore we have to come up with a different scheme for packet filtering. The new scheme is based on the ideas that, 1) when receiving a packet copy from child component Cj, the agent on Ci, instead of updating Ti.ti,j and setting the packet's remote stamp with the tagged value, records the copy as the latest from that component; 2) when forwarded to a sub-component, the "spStop" marker is tagged with, instead of Ti.ti,j, the latest packet from that component; and 3) when receiving marker "spStop", the local agent looks up the tagged packet from the sample buffer and retrieves the local stamp of the found entry. Then the retrieved counter is used for packet filtering such that, compared to the retrieved counter, any packet with a greater local stamp is discarded, as well as the packets associated with the same inter-component interaction.
In the design, there is an agent logically associated with each node to be managed. However an agent can be physically associated with (i.e., installed on) a managed node, or deployed/configured and shared by multiple nodes. With the design decisions made, Figure 8 depicts the architecture of WTM that is a three-tier processing model. The first-tier is the sampling ASIC that samples packets under the guidance of the middle-tier agent. A WTM agent coordinates or participates in the causal sampling protocol, and performs bottom-to-top measurement for the associated nodes. The third tier, WTM server, based on the measurement data gathered from associated agents, can perform, at the entity level, the tasks of measurement aggregation, problem analysis and isolation, statistics report and visualization, etc.
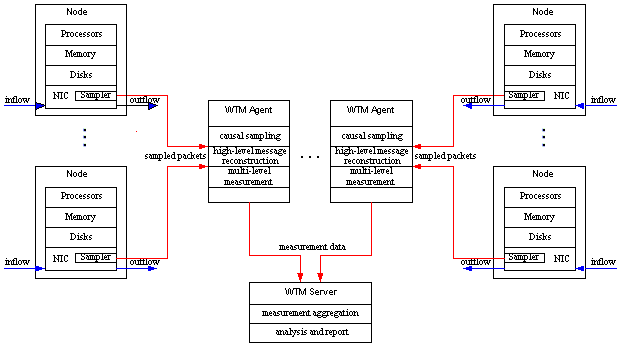
Figure 8. The architecture of WTM
To evaluate the efficiency of the WTM protocols, we have conducted extensive simulation based on a Web transaction architecture illustrated in Figure 9. In this architecture, we suppose that four different clients C0, C1, C2, and C3 concurrently request services from a service provider S0 that is a multi-tier system. It means that S0 has its sub service providers that in turn can have its own. To add more dynamism, we suppose that S0 can dynamically choose to interact with one of S1, S2, and S3 that in turn can choose to interact with one of S5 and S6. Each service provider can be either an across-domain entity or a remote component sitting in the same domain with its parent. When receiving a request, each entity may involve some local processing as well as an RPC interaction with its sub service providers.
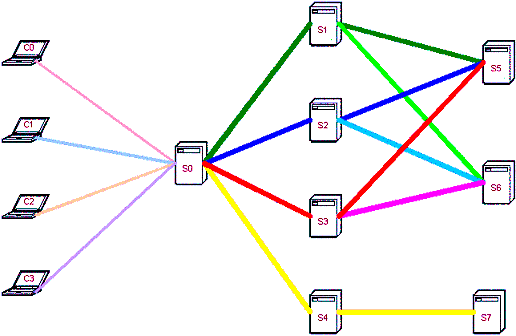
Figure 9. The simulation architecture
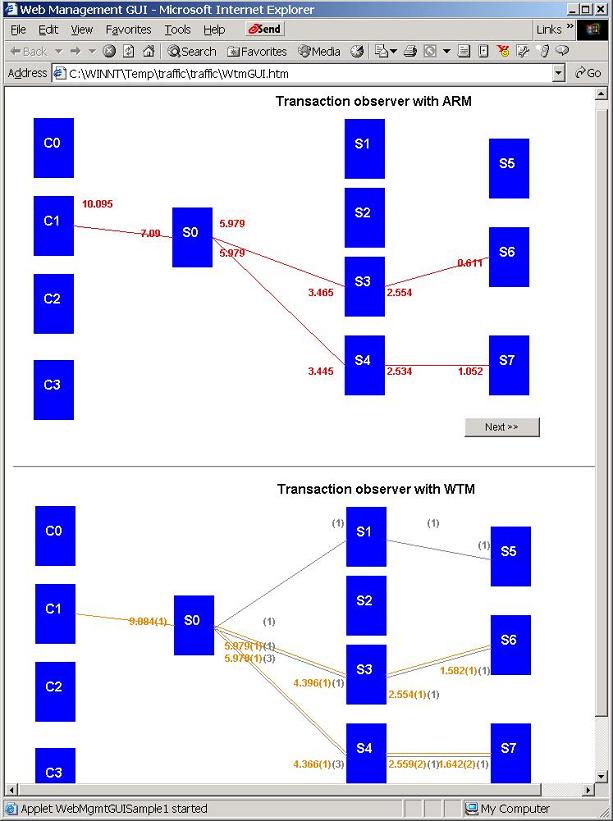
Figure 10. Real-time monitoring using ARM versus WTM
Table 3. Sampling with ARM instrumentation and correlation
| Path 1 | Path 2 | Path 3 | Path 4 | Path 5 | Path 6 | Load/Component | |
|---|---|---|---|---|---|---|---|
| C0 | 0,10.2:1 | n/a | n/a | 0,8.9:3 | 0,10.9:1 | 0,10.5:2 | 0,9.8,7,25.9% |
| C1 | n/a | 0,10.8:1 | n/a | 0,8.5:1 | 0,9.7:3 | 0,11.5:1 | 0,9.9,6,22.2% |
| C2 | 0,9.9,:3 | n/a | 0,11.5:4 | 0,10.1:1 | 0,10.1:1 | 0,10.4:1 | 0,10.6,10,37% |
| C3 | 0,11.6:2 | 0,8.3:2 | n/a | n/a | n/a | n/a | 0,9.9,4,14.8% |
| S0 | 7.9:6,6.1:6/6.6:6 | 6.8:3,6.0:3/5.4:3 | 8.3:4,6.0:4/7.1:4 | 6.7:5,5.6:5/5.7:5 | 6.8:5,5.5:5/5.7:5 | 7.5:4,6.0:4/5.6:4 | 7.3,6.0,27,100% |
| S1 | 4.1:6,3.0:6 | 4.1:3,3.1:3 | n/a | n/a | n/a | n/a | 4.1,3.0,9,33.3% |
| S2 | n/a | n/a | 3.9:4,2.7:4 | 3.6:5,2.6:5 | n/a | n/a | 3.7,2.6,9,33.3% |
| S3 | n/a | n/a | n/a | n/a | 3.7:5,2.5:5 | 4.1:4,2.8:4 | 3.9,2.6,9,33.3% |
| S4 | 4.2:8,3.8:6 | 3.4:3,2.4:3 | 4.3:4,2.6:4 | 3.6:5,2.6:5 | 3.9:5,2.7:5 | 3.8:4,2.6:4 | 3.9,2.8,27,100% |
| S5 | 0.8:6,0 | n/a | 0.7:4,0 | n/a | 0.7:5,0 | n/a | 0.74,0,15,56% |
| S6 | n/a | 0.57:3,0 | n/a | 0.49:5,0 | n/a | 0.63:4,0 | 0.56,0,12,44% |
| S7 | 0.58:6,0 | 0.65:3,0 | 0.79:4,0 | 0.81:5,0 | 0.62:5,0 | 0.69:4,0 | 0.68,0,27,100% |
| Load/Path | 6,22.2% | 3,11.1% | 4,14.8% | 5,18.5% | 5,18.5% | 4,14.8% |
Table 4. Sampling with the causal sampling protocol
| Path 1 | Path 2 | Path 3 | Path 4 | Path 5 | Path 6 | Load/Component | |
|---|---|---|---|---|---|---|---|
| C0 | 0,10.2:1 | n/a | n/a | 0,8.9:3 | 0,10.9:1 | 0,10.5:2 | 0,9.8,7,25.9% |
| C1 | n/a | 0,10.8:1 | n/a | 0,8.5:1 | 0,9.7:3 | 0,11.5:1 | 0,9.9,6,22.2% |
| C2 | 0,9.9,:3 | n/a | 0,11.5:4 | 0,10.1:1 | 0,10.1:1 | 0,10.4:1 | 0,10.6,10,37% |
| C3 | 0,11.6:2 | 0,8.3:2 | n/a | n/a | n/a | n/a | 0,9.9,4,14.8% |
| S0 | 9.5:6,6.1:4.83/6.5:6 | 8.1:3,5.8:2.5/5.4:3 | 10.5:4,6.3:2.83/6.7:4 | 8:5,5.6:4.5/5.8:5 | 8.6:5,5.5:5/5.6:5 | 9.6:4,6.2:2.67/6.1:4 | 9.0,6.0,19,100% |
| S1 | 5.0:4.83,3.0:3.33 | 4.8:2.5,2.9:2.5 | n/a | n/a | n/a | n/a | 4.9,3.0,6,30.4% |
| S2 | n/a | n/a | 4.9:2.83,2.9:2.5 | 4.5:4.5,2.6:4.5 | n/a | n/a | 4.6,2.7,7,36.5% |
| S3 | n/a | n/a | n/a | n/a | 4.5:5,2.5:4 | 5.1:2.67,3.0:2.33 | 4.7,2.6,6,33.1% |
| S4 | 5.6:6,2.8:6 | 3.4:3,2.4:3 | 5.1:4,2.7:4 | 4.5:5,2.7:5 | 4.5:5,2.7:5 | 3.8:4,2.6:4 | 4.6,2.7,19,100% |
| S5 | 1.8:3.33,0 | n/a | 1.6:2.5,0 | n/a | 1.6:4,0 | n/a | 1.6,0,10,51% |
| S6 | n/a | 1.34:2.5,0 | n/a | 1.5:4.5,0 | n/a | 1.6:2.33,0 | 1.4,0,9,49% |
| S7 | 1.7:6,0 | 1.45:3,0 | 1.6:4,0 | 1.7:5,0 | 1.6:5,0 | 1.7:4,0 | 1.6,0,19,100% |
| Load/Path | 3.33,17.4% | 2.5,13% | 2.5,13% | 4.5,23.6% | 4,20.9% | 2.33,12.2% |
The simulation system is implemented in Java. It can be run on a single or multiple nodes where RPC is taken in the form of HTTP. Tables 3 and 4 present part of the measurement data averaged from the simulation running for five times. Each time the simulation ran for about 30 minutes. Figure 10 shows the real-time monitoring of the interactions using two different mechanisms. The first was to use ARM [5] such that the measurements reflect the actual statistics of the traffic. ARM is an industrial standard of application response measurement. It provides a set of APIs that are used to demarcate and correlate user-defined transactions in a distributed system. As a result, the underlying measurement engine captures the end-to-end and breakdown statistics of those transactions. The second was to use WTM based on the causal sampling protocol.
Figure 10 shows a specific Web interaction starting from C1. With its correlation facility, ARM, as shown in the upper diagram, was able to track down the actual execution path of the Web transaction, which is, S0, after receiving the request, interacts with S3 and S4 that in turn interact with S6 and S7 respectively. Furthermore, we were able to measure the response times of the interactions at each participating tier. For example, it took 10.1 seconds for C1 to receive the response, while it took 7.1, 5.9, and 5.9 seconds for S0 to send C1 the response, receive the response from S3, and receive the response from S4 respectively. On the other hand, the lower diagram shows the result of monitoring the same transaction using WTM. The yellow lines represent the interactions that WTM considers being part of the execution path while the yellow numbers in the parentheses indicate the number of the interactions captured. The gray lines represent the other concurrent interactions that were filtered out by the causal sampling protocol while the gray numbers in the parentheses indicate the number of the interaction filtered. Same as ARM, WTM measures the response times of the interactions. However, we can notice that there are noticeable differences in the response times in the two diagrams. They are due to different perspectives of application and network management, and consequently response times were observed at different measurement points. When using ARM to instrument application, the response time is the duration from the request being retrieved at the application level to the response being sent back at the application level. When using the sampling protocol, the response time is the duration from the last packet of the request being sampled by the sampling device to the last packet of the response being sampled. Therefore, the response times in the upper diagram are greater than the lower one, as they also include the local queuing times. Due to the implementation limitation, the differences measured may not accurately reflect the real-life situation. However, the inaccuracy is irrelevant to the validation of the protocol's effectiveness and efficiency.
While Figure 10 demonstrates the real-time monitoring, Tables 3 and 4 present the aggregate measurements using ARM and WTM accordingly.Paths in the tables are identified in such an order that path1 represents path "S0→S1→S5" while path 6 identifies path "S0→S3→S6". Each cell in the table, except the ones in the last column and the last row, contains the following statistics.The first element in the cell includes the average time, in seconds, between receiving a request and sending back a response, followed by a colon and the number of request/response pairs sampled. The second element includes the average response time, in seconds, of an RPC interaction with a subcomponent, followed by a colon and the number of RPCs sampled. If a component interacts with multiple subcomponents, the second element contains multiple pairs of "time:number" separated by '/'. For instance, the cell at the second column and the fifth row in Table 3 is "6.8:3,6.0:3/5.4:3". It represents the statistics on S0 for the Web transactions with the execution path of "S0→S1→S6". In the first element, 6.8 seconds is the average time from S0's receiving a request to sending back a response to a client, and "3" represents the number of request-response pairs sampled on S0. In the second element, the first "time:number" pair is the average response time and the number of sampled RPC interactions between S0 to S1, while the second pair are those between S0 to S4. In Table 4, there are situations where the numbers of sampled interactions are not integers. This is due to that concurrent RPC interactions were sampled. For instance, if one interaction between S0 and S1 is sampled while two between S0 and S3 are in the same sampling cycle, the sampling protocol does not know for sure which one is part of the real execution path. Instead, it records that the interaction takes place on the first link with a probability of 0.33 and on the second link with a probability of 0.67. For the same reason described above, there are noticeable differences in the response times in Tables 3 and 4.
Column "Load/Component" contains the statistics on each component for all the transactions it is involved. In each cell, the first element is the average time, in seconds, between receiving a request and sending back a response. The second is the average response time of an RPC interaction with a subcomponent. In case of multiple remote subcomponents, the largest average response time is used. The third and fourth elements represent the amount of traffic sampled, i.e., the number of RPC interactions initiated by a component, in number and percentage respectively. Column "Load/Path" contains the distribution of traffic on each different processing path. The first and second elements represent the sampled amount of traffic on a path, in number and percentage respectively.
Based on Tables 3 and 4, Figures 11 and 12 compare the percentages of the traffic load per component/path measured by ARM and WTM respectively. The ARM measurements, with the explicit correlation, reflect the actual load distributions. According to the figures, we can see that the WTM measurements match relatively well against the actual load distributions.
Figure 11. Actual and sampled traffic distribution per path
Figure 12. Actual and sampled traffic distribution per component
By using the above measurement data, the complexity and characteristics of the Web interaction can be thoroughly studied and understood. For example, not only can we get management information, e.g., response times and volumes, from an end-to-end perspective, but also break it down to different components such as network links/segments and participating servers. Also by monitoring the spatial flow of the Web traffic, we, for analysis and diagnosis purposes, can construct the message trajectory of a problematic Web transaction in particular, or infer the distribution of the spatial traffic flow in general.
Web services
are
making the Web more complex and dynamic, thus efficient and sufficient Web
traffic management is becoming critical to the continuing success of the Web. To
understand the complexity of the Web, one important aspect is to understand the
traffic characteristics in a bottom-to-top fashion. That is, the statistics need
be gathered at multiple levels including network, transport, application, and
transaction layers. As multi-tier Web computing is becoming mainstream, the
traffic, associated with a multi-tier transaction or interaction, should be
correlated so that breakdown analysis can be realized from either service
consumer or provider's perspective.
We would like to thank the referees for their valuable comments and suggestions on an earlier version of the paper.
[1] Web Services Architecture,
http://www.w3.org/TR/ws-arch/.
[2] B. Krishnamurthy and J. Rexford.
Web Protocols and Practice. Addison-Wesley, 2001.
[3] N.G. Duffield and M. Grossglauser.
Trajectory sampling for direct traffic observation. IEEE/ACM Transactions on Networking, v. 9 no. 3, pp.
280-292, June 2001.
[4] Transaction perspective. Keynote
Systems, http://www.keynote.com/solutions/solutions_pm_transaction_perspective_tpl.html.
[5] A. Sahai, J. Ouyang and Vijay
Machiraju. Extending ARM for End-to-End Correlation and Optimization of Web
Service Transactions. In Proceedings of the 3rd International Workshop on Advanced Issues
on E-Commerce and Web-based Information Systems, Milpitas, CA, 2001.
[6] A. Sahai, Vijay Machiraju, J.
Ouyang, W. Klaus. Message Tracking in SOAP-based Web Services. In Proceedings of the 8th IEEE
Network Operations and Management Symposium, Florence, Italy, April 15-19,
2002.
[7] D.E. Knuth.
Sorting and Searching, volume 3 of The Art of Computer Programming. Addison-Wesley,
1998.
[8] W. Stalling.
SNMP, SNMP v2, SNMP v3, and RMON 1 and 2 (3rd Edition). Addison-Wesley, Reading, Mass.,
1999.
[9] K.C. Claffy, H.W. Braun, and G.C.
Polyzos. Parameterizable methodology for internet traffic flow profiling. IEEE Journal on Selected
Areas in Communications, 13(8):1481-1494, October 1995.
[10] NetFlow,
http://www.cisco.com/warp/public/732/netflow/index.html.
[11] G. Almes, S. Kalidindi, and M. Zekauskas. A
one-way delay metric for IPPM. RFC 2679, September
1999. http://www.ieft.org/rfc.
[12] G. Almes, S. Kalidindi, and M. Zekauskas. A
one-way packet loss metric for IPPM. RFC 2680, September 1999.
http://www.ieft.org/rfc.
[13] R. Cáceres, N.G. Duffield, J. Horowitz, and D.
Towsley. Multicast-based inference of network-internal loss characteristics. IEEE Transactions on
Information Theory, 45:2462-2480,
1999.
[14] H. Schulzrinne, S. Casner, R. Frederick, and
V. Jacobson. RTP: A transaction protocol for real-time applications. RFC 1889, January 1996.
http://www.ieft.org/rfc.
[15] John Schroeter.
Surviving the ASIC Experience. Prentice Hall, 1991.
[16] Simple Object Access Protocol (SOAP),
http://www.w3c.org/TR/SOAP.
[17]J2EE specification,
http://java.sun.com/j2ee/download.html.
[18] J. Conard, et al. Introducing
.NET. Wrox, 2000.
[19] Common Object Request Broker Architecture
(CORBA) specification, http://www.omg.org/technology/documents/formal/corba_iiop.htm.
[20] ISAPI filter,
http://msdn.microsoft.com/library/default.asp?url=/library/en-us/iisref/html/psdk/asp/devs9qer.asp.
[21] Axis Architecture Overview, http://xml.apache.org/axis/index.html.
[22] .NET Sinks and Sink Chains, http://msdn.microsoft.com/library/default.asp?url=/library/en-us/cpguide/html/cpconsinkssinkchains.asp.
[23] Toward content-based classification.
PMC-Sierra, Inc., February 2001.