Web personalization techniques allow companies to customize their web services according to their customer's needs. However, changing customer behaviour and frequent structural changes and content updates of websites are likely to impair the underlying models. Current personalization techniques require periodic updates and human interaction to cope with this problem and thus maintain up-to-date personalization. To automate this process, we need to identify points of change (see e.g. [1]) in user behaviour automatically as the data flows in. Identifying such changes - whether they are seasonal or temporal, or a long-term behavioural trend shift - and promptly taking appropriate action in response leverages business advantage.
During our analysis of numerous web usage datasets, including data from online retail shops and an online bank, we identified three main problems that we summarize in the following three goals:
Goal 1: Detect changes in individual behaviour A solution to this problem should include incremental maintenance of a compact user profile for each individual and the output of changes. Change signals can be used to update personalized content or for marketing actions while the base profiles can help selecting the proper personalized content.
Goal 2: Report "interesting" sessions From time to time online users may not be able to find some content or they may have technical difficulties. The idea behind the second problem is to identify such points, "interesting" sessions, in a stream of user actions. Based on such alerts, an assistant may offer instant online help (e.g. chat or voice call) or the system may take prompt automated action.
Goal 3: Detect changes in user activity Detecting changes in an individual's visitation frequency seems to relate to our first problem; however, it requires different treatment both technically and in the types of output alert. For example, early identification of a decrease in an individual's visitation frequency may support actions for customer retention. Based on the different types of change in visitation frequency, we may label changes as "runner up" or "slower down" based on the increase or decrease in frequency.
The contribution our work makes is the identification of three relevant problems in individual, on-the-fly web personalization and their proposed space and computationally efficient solutions.
We choose to use a tree-like structure to represent user profiles. Each node may contain more than one page id, a frequency counter, a reference to its parent and a vector of references to its children.
Adding a session (we keep visited
pages as sets, discarding order and cardinality information) to a
profile tree can be broken down as a simpler recursive procedure.
The procedure is called, in each step, by a given tree node
![]() and the remaining pages to be inserted,
and the remaining pages to be inserted,
![]() . As a first step, we select the children of
. As a first step, we select the children of
![]() that have the highest overlap with
that have the highest overlap with ![]() . If there
are more nodes with equal, non-zero overlap we select the first
one. If
. If there
are more nodes with equal, non-zero overlap we select the first
one. If ![]() has no overlap with any of the children nodes we
insert
has no overlap with any of the children nodes we
insert ![]() as a new node under
as a new node under ![]() .
Otherwise, we identify the type of overlap. In case the children
node is equivalent to
.
Otherwise, we identify the type of overlap. In case the children
node is equivalent to ![]() or is
fully part of
or is
fully part of ![]() , we increase the counter of the children and
invoke another recursive step on the children node and the
non-overlapping remainder of
, we increase the counter of the children and
invoke another recursive step on the children node and the
non-overlapping remainder of ![]() . In the
other two cases, we need to split the children node by
subtracting and raising the overlap directly above it as a new
parent node, update the frequency counters and insert the
non-overlapping part, if there is any, as a new children node
under the newly created node of common pages.
. In the
other two cases, we need to split the children node by
subtracting and raising the overlap directly above it as a new
parent node, update the frequency counters and insert the
non-overlapping part, if there is any, as a new children node
under the newly created node of common pages.
In our methods, we maintain the profiles over a sliding window. This can be easily done by maintaining references to leaf nodes in the tree in a "round" vector.
Here we define a distance metric
over a profile tree and an incoming session (![]() ). In
fact, we define a similarity metric and we transform a distance
by
). In
fact, we define a similarity metric and we transform a distance
by
![]() . The similarity measure basically
selects a branch with the highest overlap to the input session
and calculates a score on it. Once again, we can define this
metric recursively as each node returns the number of its
overlapping pages with the subset of pages it received plus the
total overlap on the remainder of pages returned from its
children nodes. Each recursive step also returns a subscore and,
among identical overlaps, we return the highest score as
similarity. We calculate the scores at each node by taking the
minimum of the normalised node frequency (
. The similarity measure basically
selects a branch with the highest overlap to the input session
and calculates a score on it. Once again, we can define this
metric recursively as each node returns the number of its
overlapping pages with the subset of pages it received plus the
total overlap on the remainder of pages returned from its
children nodes. Each recursive step also returns a subscore and,
among identical overlaps, we return the highest score as
similarity. We calculate the scores at each node by taking the
minimum of the normalised node frequency (
![]() ) and the page
probability (
) and the page
probability (![]() ). Both norms are known upfront to the
algorithm.
). Both norms are known upfront to the
algorithm. ![]() is simply the number of pages added to the
tree and
is simply the number of pages added to the
tree and
![]() .
.
Goal 1: Detect changes in individual
behaviour A user profile is maintained for each individual
and compared, with a window of most recent sessions. First, the
tree is initialized with ![]() sessions.
The score of an incoming session is calculated using the distance
function defined in Section 2. If the
session is not an outlier
sessions.
The score of an incoming session is calculated using the distance
function defined in Section 2. If the
session is not an outlier
![]() , it is added to a buffer
(
, it is added to a buffer
(![]() ), excluding the last
), excluding the last ![]() scores,
which are kept in a buffer
scores,
which are kept in a buffer ![]() . A
change is detected when the distance (
. A
change is detected when the distance (![]() ) between
the most recent scores (
) between
the most recent scores (![]() ) and
) and
![]() is larger than a threshold,
is larger than a threshold, ![]() . The distance is defined as
. The distance is defined as
![]() ,
where
,
where ![]() is the empirical cumulative distribution
function of
is the empirical cumulative distribution
function of ![]() . If we maintain the
. If we maintain the ![]() using a balanced tree algorithm, the complexity of the algorithm
is
using a balanced tree algorithm, the complexity of the algorithm
is ![]() and the distance function,
and the distance function,
![]() , can be calculated efficiently as well.
, can be calculated efficiently as well.
Goal 2: Report "interesting"
sessions The problem of finding "interesting" sessions is
rather subjective and cannot be clearly formulated. We choose to
rate pages as "highly interesting" when they are popular for a
specific individual but rarely visited by others. Interesting
sessions are those containing interesting pages. We consider only
outlier sessions (calculated in Goal 1) as potential interesting
sessions. We calculate a new score over the outlier session based
on an automatically maintained popularity matrix. The components
of this matrix are weights calculated by the
![]() weighting applied to our data, where
weighting applied to our data, where ![]() refers
to a term (web pages) and
refers
to a term (web pages) and ![]() to
documents (individual sessions) and
to
documents (individual sessions) and ![]() is
the number of occurrences of term
is
the number of occurrences of term ![]() in
document
in
document ![]() . We label a session as interesting if its overall
score is higher than a user-defined threshold.
. We label a session as interesting if its overall
score is higher than a user-defined threshold.
Goal 3: Detect changes in user
activity While the first two problems, Goals 1 and 2, can
be included in a common framework, we need another layer of data
abstraction and a different system for the third problem. The
problem at hand is detecting change in a stream of binary data
representing whether the user was active on a given day. Our
algorithm is based on the CUSUM (cumulative sum) algorithm
[3] and we
model the probability density function (![]() ) of
the data by the poisson distribution. For a given user we
incrementally estimate the probability
) of
the data by the poisson distribution. For a given user we
incrementally estimate the probability ![]() of
visitation on a given day. The estimate
of
visitation on a given day. The estimate ![]() is
compared to
is
compared to ![]() alternatives
alternatives ![]() via the
via the
![]() sums, where
sums, where ![]() is the last change point and
is the last change point and ![]() is the
current time. Each
is the
current time. Each ![]() , for
every
, for
every ![]() , is maintained incrementally. The
, is maintained incrementally. The ![]() alternatives are fixed upfront. Given that
alternatives are fixed upfront. Given that ![]() is
more likely than the alternatives,
is
more likely than the alternatives, ![]() has a
downward trend. An increasing
has a
downward trend. An increasing ![]() indicates a change in the trend and a change is detected if
indicates a change in the trend and a change is detected if
![]() . The
complexity is linear in the number of alternatives, which is
. The
complexity is linear in the number of alternatives, which is
![]() per session.
per session.
Our experiment included results on server-side web access log data of an investment bank collected over a 1.5-year period. To evaluate our change detection methods, we randomly selected two sets each of 200 individuals with their sessions, and labelled them together with field experts. We looked at the individual sessions evolving over time and marked the points of change.
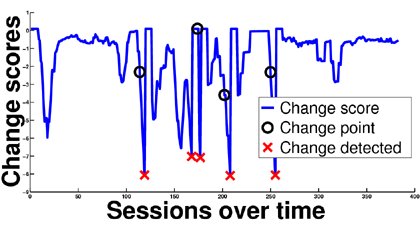
Goal 1: evaluation The accuracy of our method is 69.57% with 67 false alarms and the mean detection latency is 5.12 sessions.
Goal 2: evaluation While
experimenting with the TF-IDF scoring, we found that the high
popularity of a relatively few pages among all individuals
resulted in extreme high term frequency (![]() )
components that overweighed the
)
components that overweighed the ![]() scores and, even though popular pages were present in most
profiles, their final
scores and, even though popular pages were present in most
profiles, their final ![]() scores were much higher for common
pages than the much more interesting rare pages. To avoid the
effect of the power law distribution of web pages, we ignored the
scores were much higher for common
pages than the much more interesting rare pages. To avoid the
effect of the power law distribution of web pages, we ignored the
![]() weight and used only the
weight and used only the ![]() component in final scoring.
component in final scoring.
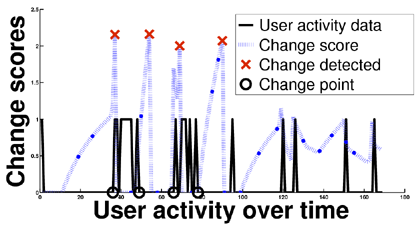
Goal 3: evaluation The accuracy of our method is 77.36% with 117 false alarms, and the mean detection latency is 6.37 days.
Figure 1 shows an example of score evolution and change detection both for Goal 1 and Goal 3. For more experimental results we refer the reader to [2].
|