1. INTRODUCTION
Search engines crawl the web to download a corpus of web pages to index for user queries. One of the most efficient ways to maintain an up-to-date corpus of web pages for a search engine to index is to re-crawl pages preferentially based on their rate of content update [3]. Much of the existing work on estimating expected rates of change has been based on the assumption that changes arrive as a Poisson process, and that the average rate of change can be estimated under this model. Given the rate at which rapidly changing pages need to be crawled, there are high costs associated with these pages both in terms of crawling resources and corpus consistency with the web. In this paper, we ask the question of whether the Poisson model truly represents the changes for rapidly updating pages, and if not, what can be gained by better understanding the real structure of page changes in terms of acquiring fresh content.
2. METHODOLOGY
Definitions:
For each page, the number
of updates that occur in a single hour, ![]() , is distributed as a Poisson distribution, with
parameter
, is distributed as a Poisson distribution, with
parameter
![]() . The
average time between changes is
. The
average time between changes is ![]() , and the time between page updates is distributed
exponentially with parameter
, and the time between page updates is distributed
exponentially with parameter ![]() .
.
Defining a `Change':
We employ a hashing technique, outlined by Charikar [1], which creates a fingerprint-like representation of the page but has the unique benefit that pages with similar content have similar hash values. Distance between hashes can be measured by the number of bits in which they differ; for this study we consider versions of a page with 6 or more bits different in their hashes to be changed.
Computing Rates of Change:
Given a history of reported
``changes,'' measured on any regular interval of length
![]() , the simple estimator is to
divide the total number of changes observed by the total time
observed. That simple estimator of the rate of change,
, the simple estimator is to
divide the total number of changes observed by the total time
observed. That simple estimator of the rate of change,
![]() , is
, is
![]() , where
, where
![]() = total time and
= total time and ![]() = total number of changes.
However, if the time between crawls of the page is remotely
similar to the rate of change of the page, this estimate is
significantly asymptotically biased. If more than one change
occurs during an interval of length
= total number of changes.
However, if the time between crawls of the page is remotely
similar to the rate of change of the page, this estimate is
significantly asymptotically biased. If more than one change
occurs during an interval of length ![]() , the crawler will only observe a single change. As a
result, if
, the crawler will only observe a single change. As a
result, if ![]() is too large compared to
is too large compared to
![]() , no matter how many
observations are taken, the estimate will always overestimate the
length of time between changes.
, no matter how many
observations are taken, the estimate will always overestimate the
length of time between changes.
Cho and Garcia-Molina, section 4.2, [2] reduce the asymptotic bias
of the simple estimator by subtracting off the expected bias and
making a small modification to remove singularities. The modified
estimator,
is demonstrated to have significantly better bias, even for
small (![]() observations,
especially when
observations,
especially when ![]() is in
the neighborhood of
is in
the neighborhood of ![]() .
Although our page crawl interval granularity will be quite small
compared to the total space of possible rates of change, the
pages we are examining have rates of change on the order of 1-2
days, and therefore the shrinkage of the estimator given by Cho
and Garcia-Molina makes a critical difference in the values.
However, if the samples are significantly non-Poisson, the
asymptotic results for this estimator do not apply. For this
reason, we will compute both
.
Although our page crawl interval granularity will be quite small
compared to the total space of possible rates of change, the
pages we are examining have rates of change on the order of 1-2
days, and therefore the shrinkage of the estimator given by Cho
and Garcia-Molina makes a critical difference in the values.
However, if the samples are significantly non-Poisson, the
asymptotic results for this estimator do not apply. For this
reason, we will compute both ![]() and the estimator
and the estimator
![]() .
.
Sampling Web Pages:
We use a multi-staged process to generate our sample. We first selected hosts according to the number of URLs they had in a feed from the Google crawl containing over 1B documents. From each host we sampled a number of URLs, crawled them twice daily, and only kept the URLs with an average rate of change of less than 48 hours. This left us with 29,000 URLs which we crawled every hour. Of those 80% had at least 500 consecutive successful fetches. This is the set of URLs we will examine and refer to as the rapid change sample. Every time a page is accessed in our sample, we compute a hash of the page's content and consider the page changed if the current hash differs from the previous by 6 or more bits.
3. DISTRIBUTION OF CONTENT CHANGES
Content Changerate Profiles:
We begin by examining the
overall distribution of rates of change given by this sample. In
our data, only a very small (![]() ) portion of the sample changes by 6 bits or more
every time we access it. However, applying the modified estimator
) portion of the sample changes by 6 bits or more
every time we access it. However, applying the modified estimator
![]() in 1, we estimate that up to 25% of our rapid
changing sample has an average rate of change less than or equal
to one hour. Over 50% of pages in the sample have an estimated
rate of change of less than 4 hours. The primary differences
between the simple estimator (
in 1, we estimate that up to 25% of our rapid
changing sample has an average rate of change less than or equal
to one hour. Over 50% of pages in the sample have an estimated
rate of change of less than 4 hours. The primary differences
between the simple estimator (![]() ) and the modified estimator (
) and the modified estimator (![]() ) occurs in the
fastest-changing bins because those are the most sensitive to the
remaining censoring introduced by our hour-granularity
sample.
) occurs in the
fastest-changing bins because those are the most sensitive to the
remaining censoring introduced by our hour-granularity
sample.
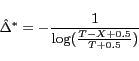
Pages with Regular Updates: Intuitively, it would seem
that many pages should show a much more regular behavior than is
dictated by the Poisson model due to automated updating of the
sites on an hourly or daily basis. Figure 1 is a heatmap of all actual between-change
intervals observed, plotted by the overall average rate of change
observed for the page. The high-frequency bins are concentrated
around the fastest-changing pages at the lower left corner.
However, there is an additional bright spot at 24-hour observed
intervals - there are significant numbers of pages with an
average rate of change near 24 hours and a large number of
changes at exactly 24 hours. Figure 2
illustrates this effect specifically for pages with ![]() = 24. The points
plotted in Figure 2 show the observed
number of change intervals of a given length, and the lighter
line shows the predicted number of change intervals of each
length from a model where observed times between changes are
distributed
= 24. The points
plotted in Figure 2 show the observed
number of change intervals of a given length, and the lighter
line shows the predicted number of change intervals of each
length from a model where observed times between changes are
distributed ![]() as implied by a
Poisson model.
as implied by a
Poisson model.
|
|
Temporal Effects in Content Updates:
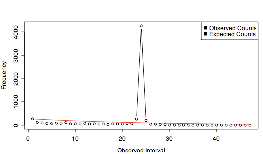
If humans or machines set by humans are the cause of page updates, those updates should have a clear temporal association. Within our rapid change sample, we divided the pages into region-associations based on the top level domain of the page. The data was aggregated into two major groups, CJK = {.cn, .jk, .ko} pages, and FIGS = {.fr, .it, .de, .es} pages. Plotting the arrival times of observed updates against the day (day is with respect to Pacific Standard Time) in Figure 3, we see that there is a significant decrease in probability of a page change between local daytime and local nighttime, and an even more significant decrease in update volume on the weekend. The graph is smoothed with a 5-hour window to reduce significant spikiness. This graph suggests that resources for refreshing pages should be prioritized to occur directly after the highest local page update volume.
4. CONCLUSIONS
The case for an aggregate Poisson model for these fast-changing pages is somewhat inconclusive: relatively few pages in our sample were strictly consistent with a Poisson model, but only a small portion differ significantly. We do show several effects that can be exploited to improve refresh performance on fast-changing pages: change volume increases depending on local time and day of the week, and fast-updating pages bias toward hourly and daily changes. We did not analyze the quality of changes seen on the URLs in our sample. One dominating question in this work is whether the large component (nearly 20%) of pages that are more consistent with a 1-hour regular change pattern than with a Poisson process are updating content useful to the user.