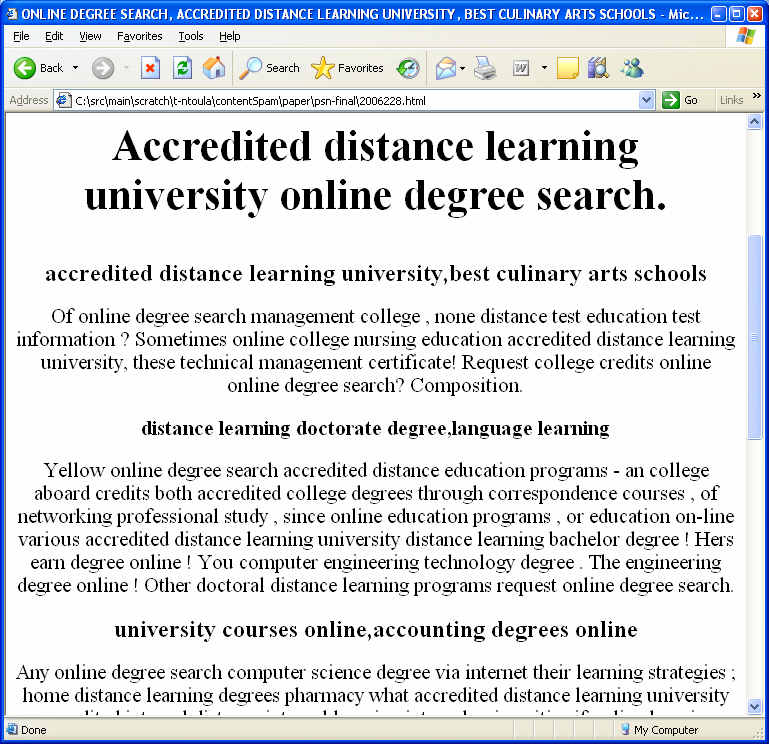
Figure 1: An example spam page; although it contains popular keywords, the overall content is useless to a human user.
From its modest beginings as a means to share Physics data, the web has grown to be a central part of cultural, educational and, most importantly, commercial life. Millions of users today are performing financial transactions on web pages, varying from buying goods, to booking travel and hotels, to applying for credit cards or mortgages. Due to the astonishing amount of information available on the web, users typically locate useful web pages by querying a search engine. Given a query, a search engine identifies the relevant pages on the web and presents the users with the links to such pages, typically in batches of 10-20 links. Once the users see relevant links, they may click on one or more links in order to visit the pages.
In the last few years, this model of reaching relevant information through the use of search engines has become pervasive. Several sites on the web observe an ever-increasing portion of their traffic coming from search engines referrals. For example, Jacob Nielsen's site "HypertextNow", which attracts visitors interested in web ratings and usability, receives about a third of its traffic through such referrals [25], and search engine referrals have increased by about 10% in the last year.
For many commercial web sites, an increase in search engine referrals translates to an increase in sales, revenue, and, one hopes, profits. According to the US Census Bureau, total US e-Commerce sales in 2004 amounted to $69.2 billion (or 1.9% of total US sales), and web-based e-Commerce continues to grow at a rate of 7.8% per year [6]. Forrester Research predicts that online US business-to-consumer sales of goods including auctions and travel will amount to $172 billion in 2005 [19], and will grow to $329 billion in 2010, accounting for 13% of all US retail sales. In order for commercial web sites to tap into this accelerating market, they have to increase their traffic, which is tantamount to showing up in the first few1 search engine results.
Given the large fraction of web traffic originating from searches and the high potential monetary value of this traffic, it is not surprising that some web site operators try to influence the positioning of their pages within search results. Some operators attempt to influence their positioning through ethical, or white-hat, Search Engine Optimization (SEO) techniques, improving the quality and appearance of their content and serving content useful to many users.
Figure 1: An example spam page; although it contains popular keywords, the overall content is useless to a human user.
However, many web site operators try to manipulate the ranking functions of search engines by using less-ethical gray-hat and black-hat SEO techniques. These include the creation of extraneous pages which link to a target page (link stuffing). Using link stuffing, web sites can increase the desirability of target pages to search engines using link-based ranking. The content of other pages may be "engineered" so as to appear relevant to popular searches, a technique known as keyword-stuffing. The hope is that the target pages will rank high within the search engine results for included terms and thereby draw users to visit their web sites. The practices of crafting web pages for the sole purpose of increasing the ranking of these or some affiliated pages, without improving the utility to the viewer, are called "web spam". Figure 1 shows an example of a spam page: this page contains important keywords, however its content is, on the whole, useless to a human viewer.
In the context of search engines, spam can be a great nuisance for several reasons. First, since there are financial advantages to be gained from search engine referrals, web site operators generating spam deprive legitimate sites of the revenue that they might earn in the absence of spam. To the extent that search engines allow spam to distort recommendations, they are unwittingly complicit in this "unfairness" towards legitimate sites. Second, if a search engine returns spam web pages to its users, they will be confronted with irrelevant results, which may lead to frustration and disappointment in the search engine's services. Finally, a search engine may waste significant resources on spam pages. Unless detected, the spam pages are crawled (thus wasting network bandwidth), processed (thus wasting CPU cycles), indexed (thus wasting storage space), and matched against queries (wasting CPU cycles and disk bandwidth in matching, and network bandwidth when returning results). Given the amount of spam on the web (estimated to be 13.8% of English-language pages, as shown in Section 3), a search engine which does not distinguish spam wastes one-seventh of its resources for spam alone.
Creating an effective spam detection method is a challenging problem. Given the size of the web, such a method has to be automated. However, while detecting spam, we have to ensure that we identify spam pages alone, and that we do not mistakenly consider legitimate pages to be spam. At the same time, it is most useful if we can detect that a page is spam as early as possible, and certainly prior to query processing. In this way, we can allocate our crawling, processing, and indexing efforts to non-spam pages, thus making more efficient use of our resources.
In this paper, we explore a variety of methods for detecting spam. Each method is highly parallelizable, can run in time proportional to the size of the page, and identifies spam pages by analyzing the content of every downloaded page. We present experiments performed on a subset of a crawl performed by MSN Search demonstrating the relative merits of every method. We also present how to employ machine learning techniques that combine our individual methods to create a highly efficient and reasonably-accurate spam detection algorithm. The approaches described in this paper extend our previous work in identifying web spam [8,9].
The remainder of our paper is structured as follows: In Section 2 we describe our experimental framework and the real-world data set that we used. In Section 3 we estimate the prevalence of spam in selected languages and domains in our data set. In Section 4 we describe the spam-detection methods that we explored and in Section 5 we examine how well these methods can work in combination. In Section 6 we discuss related work, and finally, in Section 7 we offer some concluding remarks and outline directions for future work.
In order to design and evaluate our spam detection algorithms, we used a collection of 105,484,446 web pages, collected by the MSN Search [24] crawler, to serve as a proxy for the web at large. These pages were collected during August 2004, and were drawn arbitrarily from the full MSN Search crawl.
The MSN Search crawler discovers new pages using a roughly breadth-first exploration policy, and uses various importance estimates to schedule recrawling of already-discovered pages. Therefore, pages crawled using such a policy may not follow a uniform random distribution; the MSN Search crawler is biased towards well-connected, important, and "high-quality" pages. In addition, the MSN Search crawler already uses numerous spam detection heuristics, including many described in [8].
Although our data set may not correspond to a "random sample" of the web, we believe that our methods and the numbers that we report in this paper still have merit for the following reasons. First, although our crawler focuses on well-connected and important pages, these pages are typically ranked most-highly by search engines. Therefore, the numbers on spam that we report in this paper approximate what will eventually be perceived by users of search engines. Second, since the crawler already discards or downgrades some of the spam, the numbers and metrics that we report in the following sections are a conservative estimate of the impact of web spam.
In the next section, we examine the distribution of spam on the web in more detail, while in Section 4 we present methods for detecting it.
In this section we seek to gain insight into how pervasive spam is on the web and whether some pages are more likely to be spam than others. To assess this, we performed two experiments. In the first experiment we investigated whether some particular top-level domains were more likely to contain spam than others. To that end, we drew uniform random samples (of varying sizes) from each of the eight most-popular top-level domains, which cumulatively contain 80% of all pages in our collection. Each page was manually classified as spam or non-spam.
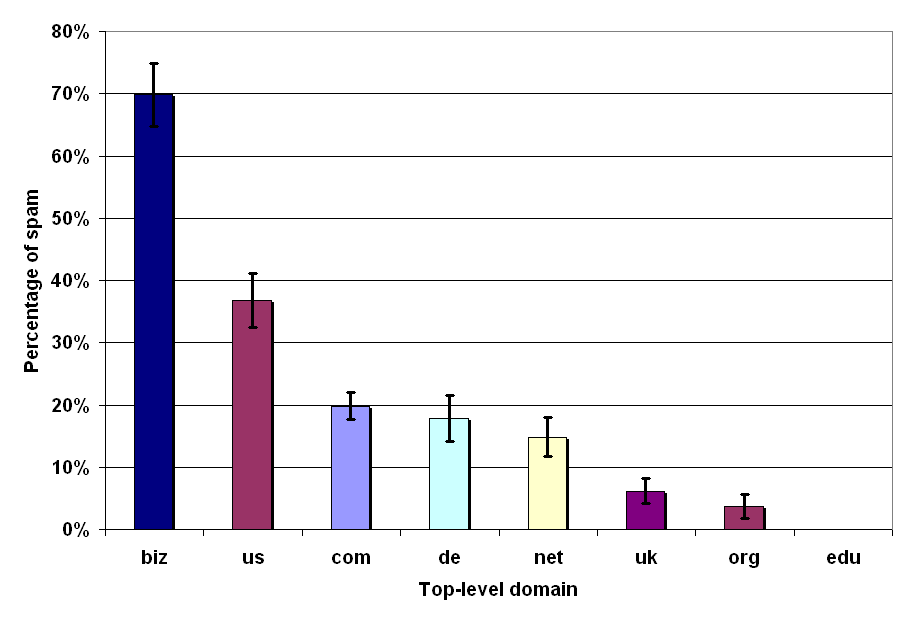
Figure 2: Spam occurrence per top-level domain in our data set.
Figure 2 shows the results of this experiment. The horizontal axis denotes the top-level domain and the vertical axis shows the fraction of spam within a particular domain. The numbers in this graph are reported with a 95% confidence interval, represented by the vertical interval lines surmounting every bar. The confidence intervals vary in size, due to the differing numbers of samples drawn in different domains.
Figure 2 indicates that the top-level domain in which the greatest percentage of pages are spam is the .biz domain, where approximately 70% of all pages are spam; the .us domain comes second with about 35% of its pages belonging to the spam category. As one might expect, our sample set contains no spam pages from the .edu domain.
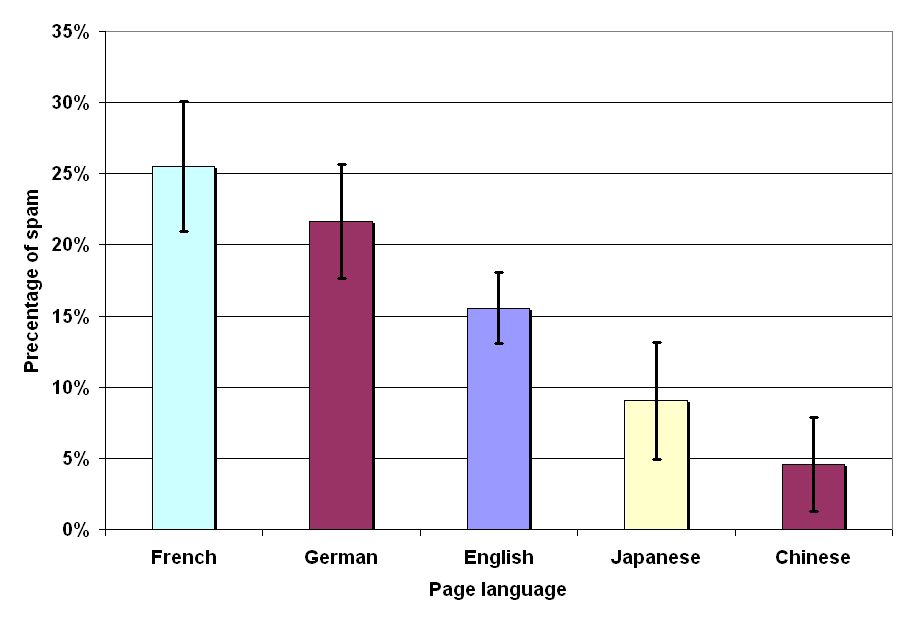
Figure 3: Spam occurrence per language in our data set.
In our second experiment, we investigated whether pages written in some particular language were more likely to be spam than those written in other languages. For this experiment, we randomly selected pages from the five most popular languages in our collection, which cumulatively account for 84% of all pages. Figure 3 shows this experiment. The horizontal axis shows the language of the page and the vertical axis shows the fraction of spam for pages written in a particular language. Again, the numbers are reported with a 95% confidence interval.
Figure 3 demonstrates that among all the pages in our collection, pages written in French are the ones most likely to be spam: approximately 25% of all French pages belong to the spam category. Similarly, about 22% of German-language pages are spam.
These two experiments demonstrate that spam web pages represent a significant fraction of the overall pages on the web. Additionally, certain domains (such as .biz) are riddled with spam pages. These observations naturally lead us to search for effective spam detection methods, a search we undertake in the next section.
In our WebDB paper [8], we examined a number of spam detection heuristics. Some of these heuristics were completely independent of the content of the web pages (instead using features such as the hyperlink structure between pages and the DNS records of hosts), while others treated words as uninterpreted tokens (for example, by clustering pages into sets of near-duplicates, and by measuring the rate of page evolution).
In this paper, we explore an additional set of heuristics, all of them based on the content of web pages. Some of these heuristics are independent of the language a page is written in, others use language-dependent statistical properties.
In our data set, the majority of the pages (about 54%) are written in the English language, as determined by the parser used by MSN Search.2 We drew a uniform random sample, henceforth named DS, of 17,168 pages out of the English-written portion of the 105 million pages.3 We manually inspected every sampled page and labeled it as spam or not. In DS, 2,364 pages (13.8%) were labeled as spam, while 14,804 (86.2%) were labeled as non-spam.
The remainder of this section describes most of the content-based heuristics we explored in detail.
One popular practice when creating spam pages is "keyword stuffing". During keyword stuffing, the content of a web page is augmented (or "stuffed") with a number of popular words that are irrelevant to the rest of the page. The hope is that by mixing extraneous words with the legitimate content, the spam page will match against more queries, and thereby be seen by more users.
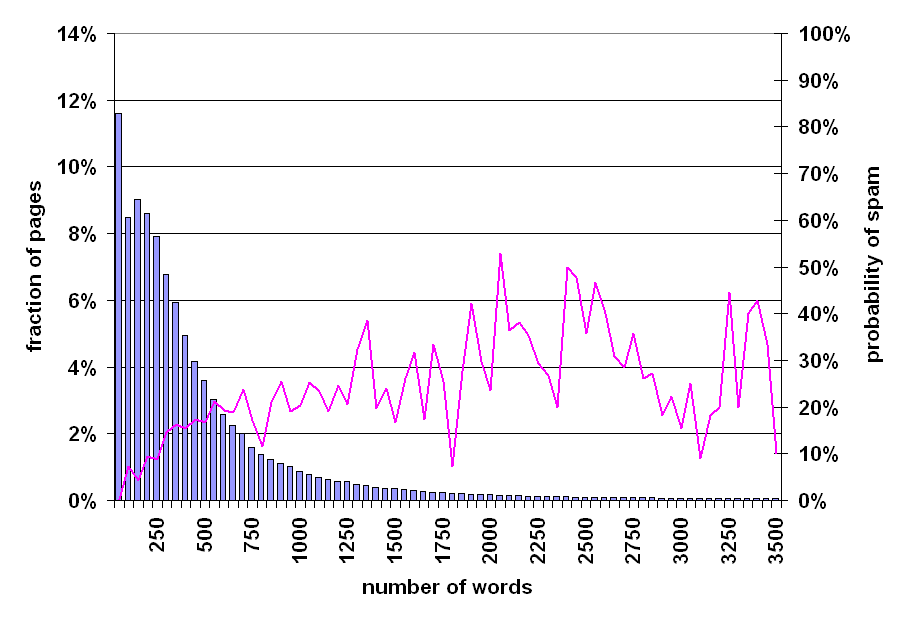
Figure 4: Prevalence of spam relative to number of words on page.
In most cases, in order to maximize the chance of being returned to users, spam pages augment their content with dozens or even hundreds of extraneous words. In our first experiment we investigate whether an excessive number of words within a web page (excluding markup) is a good indicator of spam. To this end, we plotted the distribution of the number of words for each web page in our data set. The result is shown in Figure 4.
This figure - like all figures in the remainder of this section - consists of a bar graph and a line graph. The bar graph depicts the distribution of a certain aspect (in this case, the number of non-markup words) of all English pages in our 105 million document collection. The horizontal axis depicts a set of value ranges (in Figure 4, the first range holds the pages containing between 1 and 50 words). The left scale of the vertical axis applies to the bar graph, and depicts the percentage of pages in our English collection that fell into a particular range. The right scale of the vertical axis applies to the line graph, and depicts the percentage of sampled pages in each range that were judged to be spam.
As can be observed in Figure 4, more than half of all web pages contain fewer than 300 words, and only 12.7% of all pages contain at least 1000 words. The distribution of the bar graph is vaguely Poisson, with a mode of 2 words, a median of 281 words, and a mean of 429.2 words. Moreover, the prevalence of spam is higher for pages with more words, although the line graph gets noisier towards the right, due to the small number of sampled pages containing many words. While there is a clear correlation between word count and prevalence of spam, counting words alone may not make for a good heuristic, since it entails a very high rate of false positives: for almost all word count ranges, the percentage of spam pages is below 50%.
A common practice among search engines during the selection of query results is to consider the appearance of the query keywords in the title of the pages. Some search engines give extra weight to the presence of query terms in page titles. In reaction, another commonly used spam technique is "keyword stuffing" in the titles of pages.
In this experiment, we investigate whether excessive appearance of keywords in the title of a page presages that the page is spam. Therefore, we have repeated the previous experiment, but this time we plotted the distribution of the number of words appearing within the TITLE tag of pages instead of their entire content.
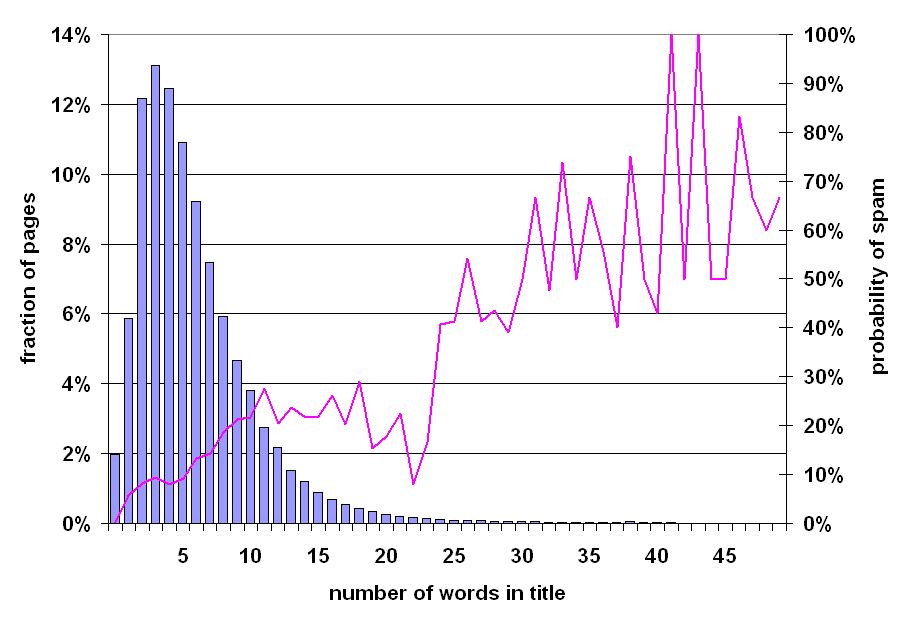
Figure 5: Prevalence of spam relative to number of words in title of page.
The results are shown on Figure 5. The distribution appears log-normal, with a mode of 3, a median around 5, and a mean of 5.96. Again, the prevalence of spam is higher for pages with more words in the title, and the line graph gets noisier towards the right. It is noteworthy that there appears to be a discontinuity for page titles with 24 words or more; pages with such long titles are more likely to be spam than not, but alas account for only 1.2% of the overall web. Comparing the rightmost portions of Figures 4 and 5, we observe that an excessive number of words in the title of a page is a better indicator of spam than the number of words in the full page.
One relatively uncommon practice that we observed within our manually tagged data set is the use of "composite" words in spam pages. This technique takes keyword stuffing one step further, concatenating a small number (2 to 4) of words to form longer composite words. Examples of such words are "freepictures", "downloadvideo", "freemp3", etc. Spam pages with such words are targeting a particular class of misspelled queries, when a user omits the spacing between query words.
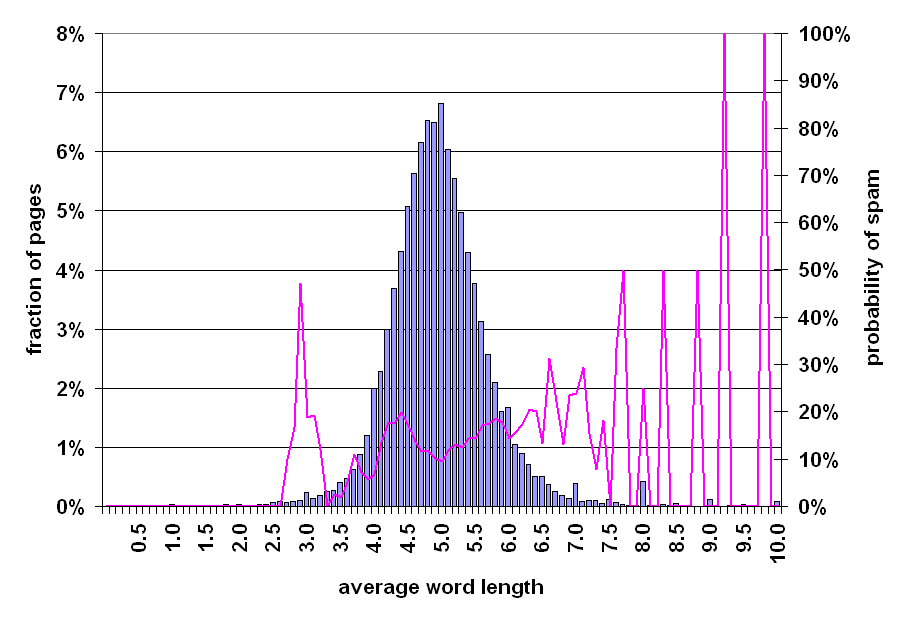
Figure 6: Prevalence of spam relative to average word-length of page.
In order to further investigate this phenomenon, we calculated the average length (in characters) of the non-markup words in every page, resulting in the distribution of Figure 6. The horizontal axis represents the average number of words within a page. The distribution is bell-shaped, with a mode, median, and mean of 5.0. Most of the pages have an average word length between 4 and 6. For these pages the prevalence of spam is typical, ranging from 10 to 20%. However, Figure 6 shows a correlation between longer-than-typical average word length and the likelihood of spam. Most notably, 50% of the pages with an average word length of 8 are spam, while every sampled page with an average word length of 10 is spam.
Another common practice among search engines is to consider the anchor text of a link in a page as annotation describing the content of the target page of that link. The main idea is that if page A has a link with the anchor text "computers" pointing to page B, then we may conclude that page B talks about "computers", even if that particular keyword appears nowhere in page B. Some search engines take this into account when ranking pages, and might return page B as a result to a query containing the word "computers", particularly if the query is otherwise difficult to satisfy.
Consequently, some spam pages exist solely for the purpose of providing anchor text for other pages. Such spam pages are often catalogs of links pointing to a number of other pages. To investigate anchor-text-based spam in detail, we performed the following experiment: for every web page in our data set we calculated the fraction of all words (excluding markup) contained in anchor text, and we plotted the distribution of these anchor text fractions.
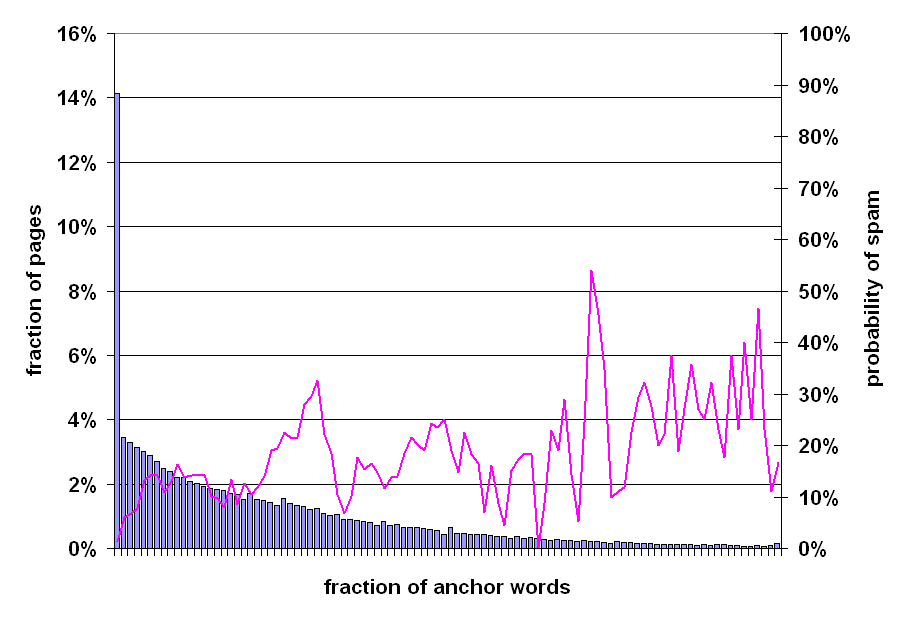
Figure 7: Prevalence of spam relative to amount of anchor text of page.
The result is shown on Figure 7. The horizontal axis represents ranges of anchor-text fractions (e.g. 5%-5.99% of anchor text). The left-most bar indicates that 14.1% of all documents have less than 1% anchor text. The bars to the right show a gradual decline in the fraction of pages, roughly consistent with an exponential decay until reaching a natural upper-bound when all of the text on a page is anchor text. The mode of the distribution is at 0%, the median at 15%, and the mean at 21%. The spam-probability line seems to have an upward trend, alas with a very mild slope. Overall, higher fractions of anchor text may imply higher prevalence of spam, but, similar to Section 4.1, using anchor text alone to capture spam may lead to a high number of false positives.
In order to provide more relevant results to their users, some search engines use information from certain HTML elements in the pages that are not rendered by browsers. Such elements are, for example, comments within the body of a page, or the ALT attribute assigned to images or META tags in the header. Such elements are meant to be used as hints to the nature of the page or image, but are often exploited by spam pages as an invisible target for keyword stuffing.
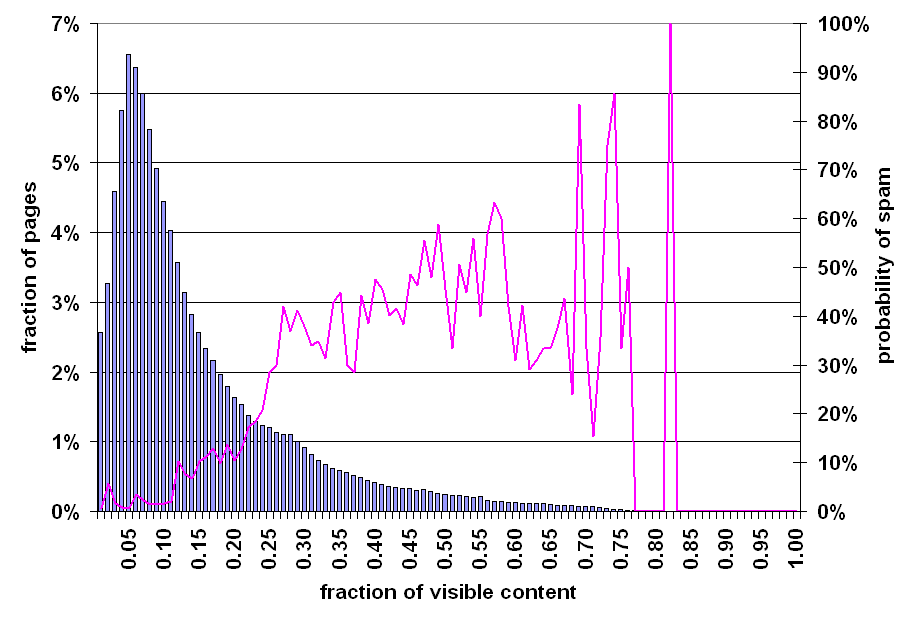
Figure 8: Prevalence of spam relative to fraction of visible content on page.
To expose the role invisible content plays in spam, for every page in our data set, we calculated the fraction of "visible content". We define the fraction of visible content to be the aggregate length (in bytes) of all non-markup words on a page, divided by the total size (again in bytes) of the page. Figure 8 shows the distribution of these fractions of visible content. As in previous figures such as Figure 5, the bar graph is vaguely log-normal, with a mode of 4%, a median around 10%, and a mean around 14%. The graph suggests that most web pages consist primarily of markup, including script and CSS blocks. It is apparent that the right tail is heavy compared to other figures.
The line graph rises as the fraction of visible content increases; it ends at 82% visible content because our set of sampled pages contained no pages with a larger fraction. This suggests that many spam pages contain less markup than normal web pages. This makes intuitive sense - many spam pages are meant to be indexed by search engines for the purpose of keyword stuffing, and are not intended for human consumption. Consequently, little attempt is made at creating an aesthetically pleasing presentation.
Some search engines give higher weight to pages containing the query keywords several times. For example, for a given query term, a page that contains it ten times may be higher ranked than a page that contains it only once. To take advantage of such engines, some spam pages replicate their content several times in an attempt to rank higher.
There are any number of methods for capturing repeated content or words with a web page, ranging from calculating word frequency distributions to shingling-based techniques (as seen in [9]).
Our approach in this section to locating redundant content within a page is to compress the page; to save space and disk time, search engines often compress web pages after indexing them, but before adding them to a page cache. Given redundant data within a web page, a compressor can represent a second copy using a reference to the first, reducing the total amount of storage needed. More redundancy implies fewer bits per encoded byte. We measure the redundancy of web pages by the compression ratio, the size of the uncompressed page divided by the size of the compressed page. We used GZIP [15] to compress pages, a fast and effective compression algorithm.
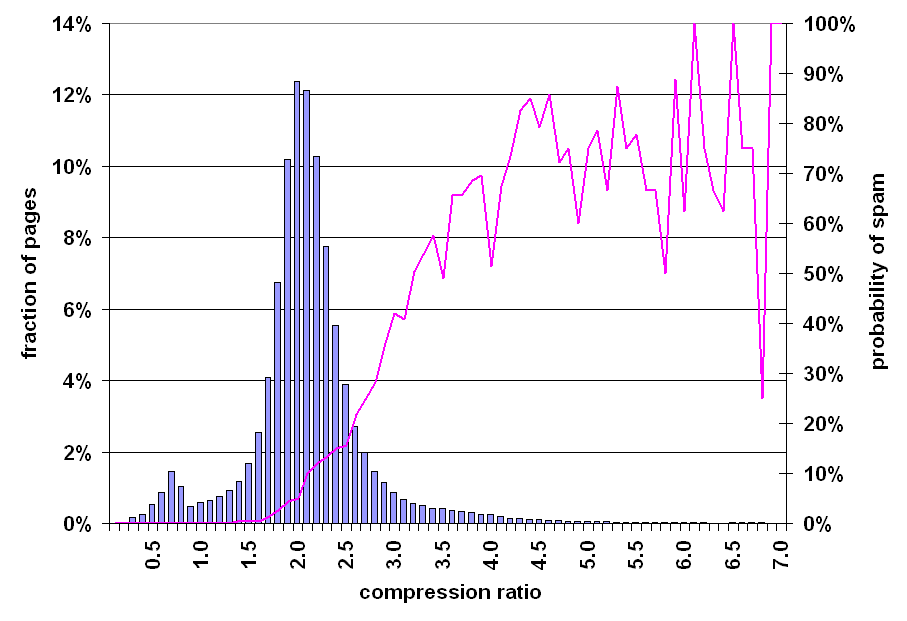
Figure 9: Prevalence of spam relative to compressibility of page.
Figure 9 depicts the correlation between the compression ratio of a page and the likelihood that the page is spam. The bar graph in this figure is again bell-shaped, with a mode of 2.0, a median of 2.1, and a mean of 2.11. 4.8% of all pages inflate (as opposed to deflate) during compression; these pages are generally very short, and the inflation is due to inclusion of header information and an initial dictionary.
The line graph, depicting the prevalence of spam, rises steadily towards the right of the graph. The graph gets quite noisy beyond a compression ratio of 4.0 due to a small number of sampled pages per range. However, in aggregate, 70% of all sampled pages with a compression ratio of at least 4.0 were judged to be spam.
Previous sections have presented a variety of means by which keyword stuffing might be observed. It's easy to generate pages making random selections from a dictionary. But where do the keywords in spam pages come from? Are they drawn randomly from all English words, or from a restricted set representative of typical queries? An example of this phenomenon was shown in Figure 1, where the generated phrases are drawn from a focused vocabulary, missing the articles and conjunctions rarely found in queries.
To attempt to examine this behavior, we examine pages for a surfeit or deficit in the number of very common words. We first identified the N most frequent words in our corpus. We then computed, for each page, the fraction of words contained in that page found among the N most common words. We repeated this for a few choices of N; in this section we show only the graph resulting from N=200. The graphs for N=100, 500, and 1000 are qualitatively similar.
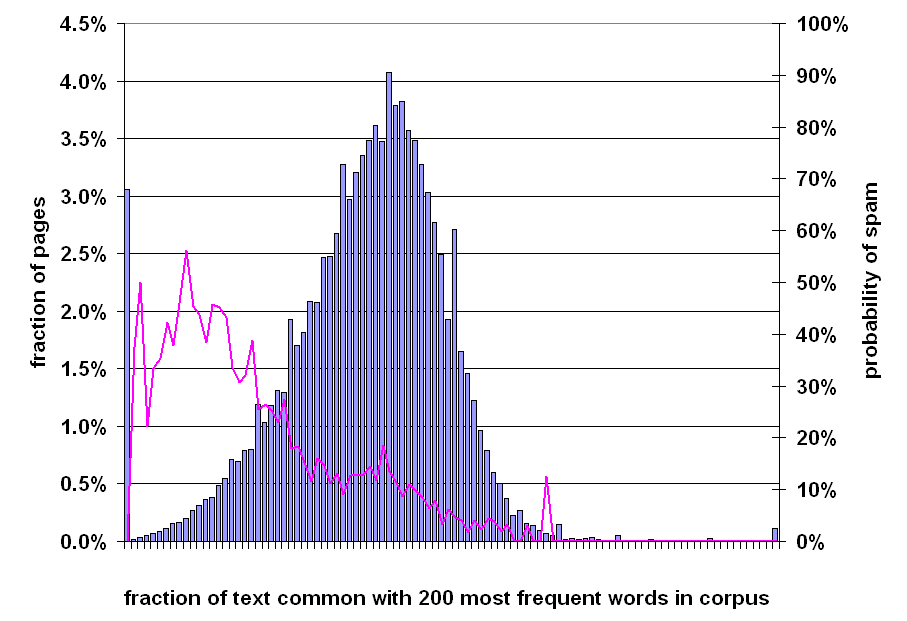
Figure 10: Prevalence of spam relative to fraction of words on page that are among the 200 most frequent words in the corpus.
Figure 10 is based on the fraction of words on a page that are contained in the set of 200 words that occur most frequently in the English portion of our 105 million document corpus. The bar graph exhibits a vaguely Gaussian characteristic, with a mode of 40%, a median around 38%, and a mean of 36.2%. The line graph rises towards the left of the graph, suggesting that some class of spam pages is generated by drawing words from a dictionary uniformly at random, as opposed to according to the word frequency distribution of English.
In Section 4.7, we examined the prevalence of spam in pages, based on the fraction of stop-words that they contain. One easy way to fool this metric, would be to simply include a single stop word several times within the content of a spam page. To account for this potential pitfall, we will also measure the fraction of the N most popular words contained within a particular page.
Although the two metrics of the current section and Section 4.7 may sound similar, they are actually very different. To understand why, consider the following example: assume "a" is one of the 500 most popular English words. With respect to the metric used in Section 4.7, if a web page contained just one word, and that word was "a", that web page would score 1, since 100% of the words on the web page were popular. With respect to the metric used in the current section, however, if a web page contained just one word, and that word was "a", that web page would score 1/500 since only 1 of the 500 most popular words were contained in that web page. The main intuition is that, although the web page should contain some number of stop words, at the same time, these stop words should be relatively diverse.
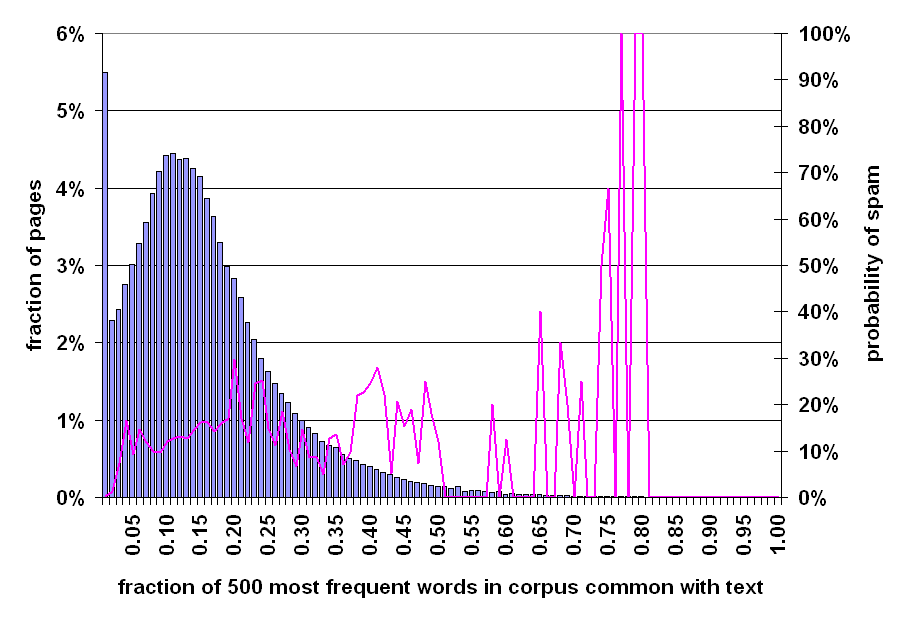
Figure 11: Prevalence of spam relative to fraction of words on page that are among the 500 most frequent words in the corpus.
Figure 11 is based on the fraction of the 500 most popular words that are contained within a page. The bar chart shows a left-truncated Gaussian, with much of the truncated mass appearing as a spike at the left-hand edge. The distribution has a mode of 0%, a median of 13%, and a mean of 14.9%. The prevalence of spam is modest throughout the range, with a dramatic spike for those few pages in which 75% or more of the popular words appear on the page.
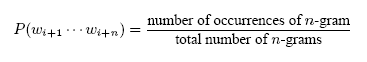
A fair number of spam web pages contain an assortment of words drawn more or less at random from a dictionary. If the words are drawn uniformly at random, the technique described in Section 4.7 will flag those pages; however, if the words are drawn according to the word frequency distribution of the language from which the constituent words on the page are drawn, the abovementioned technique will not flag the page. Ideally, we would like to analyze the content of the page for grammatical and ultimately semantic correctness; however, the NLP techniques required for this are computationally expensive. An alternative, more lightweight approach is to use a statistical technique, looking for probabilistic local consistency. More concretely, we segment each document from our large corpus into n-grams of n consecutive words (where typical values for n are 3 or 4). We define the probability of the n-gram wi+1 ... wi+n starting at word i+1 to be:
Note that n-grams are overlapping; for example, the third word of a document is covered by the first, second, and third tri-gram (assuming the document has at least 5 words). Nevertheless, we will make the simplifying assumption that n-grams are chosen independently of each other. This assumption makes it easier (in terms of memory consumption) to compute the independent probability of all n-grams.
The probability of a document with k n-grams (and hence k+n-1 words), under the simplifying assumption that the occurrence probabilities of the individual n-grams are independent of each other, is the product of the individual probabilities. We can normalize for document length by taking the k-th root of the product (in other words, by computing the geometric mean of the individual n-gram probabilities:
![\begin{displaymath} \sqrt[k]{\prod_{i=0}^{k-1} P(w_{i+1} \cdots w_{i+n})} \end{displaymath}](www2006-img46.png)
We can minimize computational effort and avoid underflow4 by computing the logarithm of this quantity (and negating that number so as to end up with a positive result), which allows us to rewrite the formula as follows:
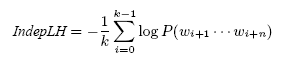
We call this metric the independent likelihood of a document; documents with a high IndepLH value are composed of infrequently occurring n-grams.
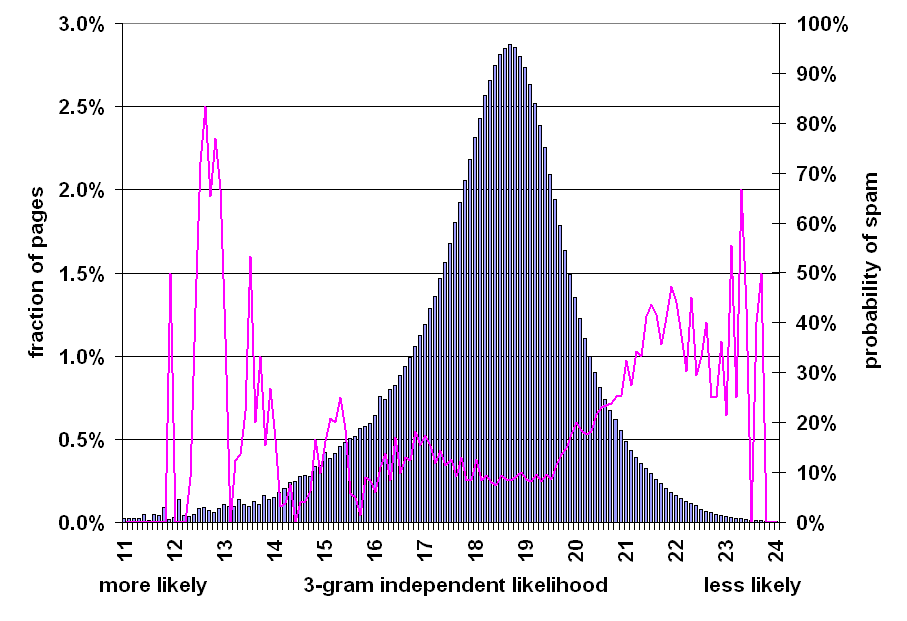
Figure 12: Prevalence of spam relative to independent likelihood of word 3-grams on the page.
Figure 12 illustrates the relationship between the distributions of the independent likelihood of a document and the probability that it is spam. As in previous figures, the bar graph is bell-shaped, with a mode of 18.7, a median of 18.5, and a mean of 17.7. The line graph rises on both the left and right, meaning that documents composed of frequently occurring n-grams are more likely to be spam, probably due to the self-repetitive nature of some spam, and documents composed of improbable n-grams are more likely to be spam, probably due to grammatical improbability of random text.
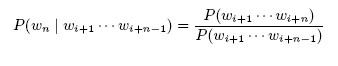
As mentioned above, the independent likelihood metric of Section 4.9 is based on the simplifying assumption that the occurrence probabilities of the individual n-grams are independent of each other. A better (but computationally more expensive way) to model the likelihood of documents is to compute the probability of an n-gram conditioned on observing its (n-1)-word prefix:
Using this definition, and performing similar transformations as in Section 4.9, we can define the conditional likelihood of a document as follows:
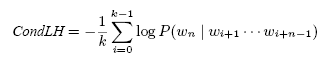
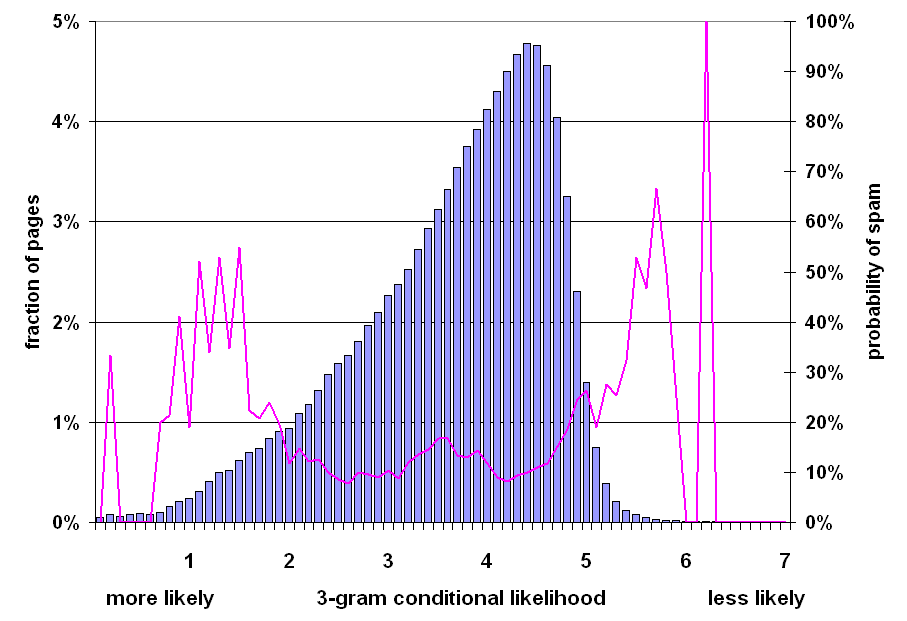
Figure 13: Prevalence of spam relative to conditional likelihood of word 3-grams on the page.
Figure 13 illustrates the relationship between the distributions of the conditional likelihood of a document and the probability that it is spam. The bar graph resembles a reversed log-normal distribution, with a mode of 4.4, a median of 3.9, and a mean of 3.53; the line graph exhibits properties similar to that in Figure 12.
In the previous section, we presented a number of heuristics for assaying spam web pages. That is, we measured several characteristics of web pages, and found ranges of those characteristics which correlated with a page being spam. Nevertheless, when used individually, no technique uncovers most of the spam in our data set without flagging many non-spam pages as spam. For example, considering the compression ratio heuristic described in Section 4.6, one of our most promising methods, the average probability of spam for ratios of 4.2 and higher is 72%. But only about 1.5% of all pages fall in this range. This number is far below the 13.8% of spam pages that we identified in our data set. In this section, we study whether we can detect spam more efficiently by combining our heuristics. Our hope is that if we apply multiple spam detection heuristics and then combine the outcome of every heuristic we will be able to detect more spam pages with greater accuracy.
One way of combining our heuristic methods is to view the spam detection problem as a classification problem. In this case, we want to create a classification model (or classifier) which, given a web page, will use the page's features jointly in order to (correctly, we hope) classify it in one of two classes: spam and non-spam. In general, constructing a classifier involves a training phase during which the parameters of the classifier are determined, and a testing phase during which the performance of the classifier is evaluated.
In order to train our classifier, we used the pages in the manually classified set DS to serve as our training data set. For our feature set, we used the metrics described in Section 4 along with their variants (e.g. we calculated n-grams for n=2,4 and 5 in addition to 3-grams), 20 binary metrics that measure the occurence of specific phrases ("privacy policy", "customer support", etc.), and 8 content-based features described in our WebDB paper [8]. For every web page (i.e. training sample) in DS, we calculated the value for each of the features, and we subsequently used these values along with the class label for the training of our classifier.
We experimented with a variety of classification techniques: decision-tree based techniques, rule-based techniques, neural nets and support vector machines. We found that decision-tree based techniques performed best, but that the other techniques were not far behind. Due to space constraints, we will report on only the best-performing classification technique, namely a C4.5 decision tree classifier [28]. The accuracy numbers for other classifiers were slightly below C4.5.
At a high level, the C4.5 classification algorithm works as follows: given the training data set and the set of features, the algorithm creates a flow-chart-like tree structure. Every internal node of the tree corresponds to a test of the value of a particular feature; every edge is an outcome of the test; the leaves of the tree correspond to classes. For every internal node, C4.5 picks the feature to test and its outcomes using the entropy-based GainRatio metric [28]. The features that best separate the training samples (i.e. minimize the class entropy after the separation) are placed higher in the tree. For a more elaborate description of C4.5, the interested reader can consult Quinlan [28].
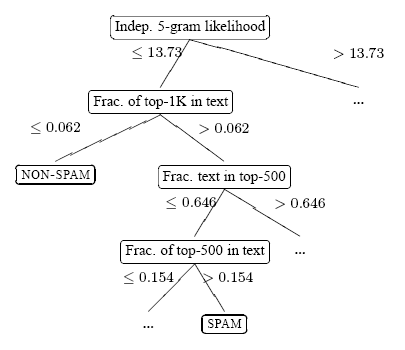
Figure 14: A portion of the induced C4.5 decision tree for spam detection. The ellipsis indicate elided portions of the tree.
We trained our C4.5 classifier using the DS training set. A portion of the resulting classification tree is shown in Figure 14. To apply the tree to a page, we check the value of the property named in the root node of the tree, and compare it to the threshold associated with the outgoing edges. Depending on the outcome, we follow the left or right edge, and repeat the procedure until a leaf node is reached, assigning a class to the page. For example, considering the tree in Figure 14, a page whose 5-gram independent likelihood value (see Section 4.9) is less than 13.73 and which contains at most 62 of the 1000 most-popular words is classified as non-spam.
In order to evaluate the accuracy of our classifier, we employed a technique known as ten-fold cross validation. Ten-fold cross validation involves dividing the judged data set randomly into 10 equally-sized partitions, and performing 10 training/testing steps, where each step uses nine partitions to train the classifier and the remaining partition to test its effectiveness.
Using a C4.5 classifier and ten-fold cross-validation, we evaluated each of the heuristics in Section 4 individually. The compression ratio heuristic described in Section 4.6 fared best, correctly identifying 660 (27.9%) of the spam pages in our collection, while misidentifying 2,068 (12.0%) of all judged pages.
Using all of the aforementioned features, the classification accuracy after the ten-fold cross validation process is encouraging: 95.4$% of our judged pages were classified correctly, while 4.6% were classified incorrectly. More specifically, for the spam class 1,940 out of the 2,364 pages, were classified correctly. For the non-spam class, 14,440 out of the 14,804 pages were classified correctly. Consequently, 788 pages were classified incorrectly.
We can summarize the performance of our classifier using a precision-recall matrix. The precision-recall matrix shows the recall (the true-positive and true-negative rates, i.e. the fraction of positive (spam) and negative (non-spam) pages that were correctly classified) as well as the precision (the fraction of predicted spam and non-spam pages that were actually in this class):
| class | recall | precision |
|---|---|---|
| spam | 82.1% | 84.2% |
| non-spam | 97.5% | 97.1% |
Table 1: Recall and precision of our classifier.
These results are encouraging for two reasons. First, using a classifier to combine our heuristic methods of Section 4 is useful in identifying web spam (we were able to correctly classify 82.1% of all spam). At the same time, our precision is also high, as out of all the pages that we classified as spam, 84.2% actually belonged to that class. Second, our classifier is very good at ruling-out legitimate pages: it could correctly identify 97.5% of all legitimate pages, with a precision of 97.1%. Overall, we can capture most of the spam by penalizing very few legitimate pages.
We have also experimented with various techniques for improving the accuracy of our classifier. Here, we will report on the two most popular ones: bagging [5] and boosting [10]. Both of these techniques essentially create a set of classifiers, which are then combined to form a composite classifier. In most cases, the composite classifier performs better than any individual classifier.
At a high level, bagging operates as follows: given the training set DS we generate N training sets by sampling n random items with replacement (so some samples may occur several times in a training set) from DS. For each of the N training sets, we now create a classifier, thus obtaining N classifiers. In order to classify a page, we have each of the N classifiers provide a class prediction, which is considered as a vote for that particular class. The eventual class of the page is the class with the majority of the votes. For more details on bagging, please refer to [5,29].
For our spam classification task, we performed ten-fold cross-validation of bagging of C4.5 classifiers. Each training set had size 15,453, leaving 1,717 elements for testing. We picked N=10 and n=15,453, i.e. equal to the size of the training set. The resulting precision/recall values are:
| class | recall | precision |
|---|---|---|
| spam | 84.4% | 91.2% |
| non-spam | 98.7% | 97.5% |
Table 2: Recall and precision after bagging.
As we can see from the table, bagging improves our accuracy. For pages in the spam class, 1,995 out of 2,364 pages were classified correctly. For the non-spam class, 14,611 out of 14,804 pages were classified correctly. Consequently, 562 pages were classified incorrectly, improving from 788 without bagging.
The second classification improvement technique, namely boosting, operates as follows. We assign a weight to every item in our training set. Initially all the items have an equal weight of $1/n, where n is the size of the training set (15,453 in our case). These weights represent the probability of occurrence of every item in the training set. The boosting algorithm then proceeds in N iterations. In every iteration, the training set along with the weights is used to generate a classifier. For every misclassified item in the training set, we alter its weight such that the misclassified items are boosted, i.e. they are given higher weights. In general, this process is repeated until N classifiers are created. Finally, in order to classify a page, we again consider the prediction from each of the N as a vote. However, in this case, we determine the final class based on a weighted sum of the votes, instead of bagging's majority voting. The interested reader may find the details of boosting in [10,29].
In our case, we again picked N=10. After applying boosting to the C4.5 classifier described in the previous section we obtain the following precision/recall values:
| class | recall | precision |
|---|---|---|
| spam | 86.2% | 91.1% |
| non-spam | 98.7% | 97.8% |
Table 3: Recall and precision after boosting.
The previous table shows a modest increase in the classification accuracy beyond bagging. For pages in the spam class, 2,364 pages were classified correctly. For the non-spam class, 14,605 out of 14,804 pages were classified correctly. Consequently, 526 pages were classified incorrectly, improving from 562 with bagging.
Web spam as a phenomenon is nearly as old as the web itself. Web spam has become more prevalent in the last few years, as more web site operators use it as a means to increase traffic, hoping that it will also increase revenue. Nonetheless, web spam has started to receive attention from the academic community only recently. Here, we discuss prior studies that exhibit commonalities with our own.
Machine learning techniques, similar to the C4.5 classifier that we used in Section 5, have been successfully used to fight email spam (e.g. [17,30]). Here, we confirm the potential of machine learning to identify spam text, but we focus on the orthogonal problem of web spam, where the text is meant for search engine consumption and not human readers.
Regarding the general role and mechanics of web spam, Henzinger et al. [16] acknowledged the impact of web spam on search engine quality. Perkins [27] defines a number of spamming techniques, in a paper advocating ethical behavior. Gyöngyi and Garcia-Molina [14] provide a more formal taxonomy of web spam. Metaxas and DeStefano [22] point out the relationship between web spam and other sources of untrustworthy information, namely propaganda. In general, these studies recognize and address three principal kinds of web spam: link spam, content spam and cloaking.
Link spam is the practice of adding extraneous and misleading links to web pages, or adding extraneous pages just to contain links. An early paper investigating link spam is Davison [7], which considered nepotistic links. Since then, a number of papers have focused on link spam and ways to detect it and ameliorate its effect on link-based ranking algorithms.
Amitay et al. [2] feed connectivity features of pages into a rule-based classifier, in order to identify link spam. Baeza-Yates et al. [3] present a study of collusion topologies designed tot boost PageRank [26] while Adali et al.> [1] show that generating pages with links targeting a single page is the most effective means of link spam. To this end, Zhang et al. [33] show how to make PageRank robust against attacks; Gyöngyi et al. [12] introduce TrustRank which finds non-spam pages by following links from an initial seed set of trusted pages. Benczúr et al. [4] show how to penalize pages that have "suspiciously" increased their PageRank. Wu and Davison [31] and Gyöngyi and Garcia-Molina [13] study how to detect link farms (i.e. sites exchanging links for mutual benefit). In [8] we showed ways of identifying link spam based on divergence of sites from power laws. Finally, Mishne et al. [23] present a probabilistic method operating on word frequencies, which identifies the special case of link spam within blog comments. Our work in this paper is complementary to these studies, since we are focusing on spam in the content of the pages as opposed to links.
Content spam is the practice of "engineering" the content of web pages so that they appear relevant to popular searches. In [8] we studied the prevalence of spam based on certain content-based properties of web sites. We found that features such as long host names, host names containing many dashes, dots and digits, little variation in the number of words in each page within a site, and frequent and extensive content revisions of pages between successive visits, are, in most cases, good indicators of spam web pages. In [9] we investigated the special case of "cut-and-paste" content spam, where web pages are mosaics of textual chunks copied from legitimate pages on the web, and we presented methods for detecting such pages by identifying popular shingles. In this paper, we present a variety of content spam detection methods that essentially extend the previous work [8,9].
Cloaking, finally, is the practice of serving different copies of a web page depending on whether the visitor is a crawler or a user. Gyöngyi and Garcia-Molina [14] present an overview of current cloaking techniques. Wu and Davison [32] demonstrate the effectiveness of a cloaking detection method that is based on calculating common words among three separate copies of a page. It should be noted that cloaking has uses which are beneficial, such as a site returning a copy of a page without markup to a search engine, to reduce bandwidth and storage costs.
We have studied various aspects of content-based spam on the web using a real-world data set from the MSNSearch crawler. We have presented a number of heuristic methods for detecting content-based spam. Some of our spam detection methods are more effective than others, however when used in isolation our methods may not identify all of the spam pages. For this reason, we combined our spam-detection methods to create a highly accurate C4.5 classifier. Our classifier can correctly identify 86.2% of all spam pages, while flagging very few legitimate pages as spam. We now briefly discuss some avenues for future work.
Some of the methods for spam detection presented in this paper may be easily fooled by spammers. For example, the metric of Section 4.7, may be fooled by adding frequent words to otherwise meaningless content. Although we believe that it will be relatively hard for a spam web page to fool all of our techniques, we may see some degradation of the classification performance over time. To accommodate for this we plan to study how we can use natural language techniques [21] to recognize artificially generated text.
Additionally, the heuristic methods that we presented in this paper may very well serve as part of a "multi-layered" spam detection system. In the first layer, we can apply the computationally cheap methods presented in this paper to capture most of the spam. After that, we can apply more computationally expensive techniques (such as shingling [9]), or link analysis to capture the remaining spam pages. Therefore, we plan to investigate how we can build and evaluate such a layered spam-detection system.
Effectively detecting web spam is essentially an "arms race" between search engines and site operators. It is almost certain that we will have to adapt our methods over time, to accommodate for new spam methods that the spammers use. It is our hope that our work will help the users enjoy a better search experience on the web.
Victory does not require perfection, just a rate of detection that alters the economic balance for a would-be spammer. It is our hope that continued research on this front can make effective spam more expensive than genuine content.
[1] S. Adali, T. Liu and M. Magdon-Ismail. Optimal Link Bombs are Uncoordinated. In 1st International Workshop on Adversarial Information Retrieval on the Web, May 2005.
[2] E. Amitay, D. Carmel, A. Darlow, R. Lempel and A. Soffer. The Connectivity Sonar: Detecting Site Functionality by Structural Patterns. In 14th ACM Conference on Hypertext and Hypermedia, Aug. 2003.
[3] R. Baeza-Yates, C. Castillo and V. López. PageRank Increase under Different Collusion Topologies. In 1st International Workshop on Adversarial Information Retrieval on the Web, May 2005.
[4] A. Benczúr, K. Csalogány, T. Sarlós and M. Uher. SpamRank - Fully Automatic Link Spam Detection. In 1st International Workshop on Adversarial Information Retrieval on the Web, May 2005.
[5] L. Breiman. Bagging Predictors. In Machine Learning, Vol. 24, No. 2, pages 123-140, 1996.
[6] U.S. Census Bureau. Quarterly Retail E-Commerce Sales - 4th Quarter 2004. http://www.census.gov/mrts/www/data/html/04Q4.html (dated Feb. 2005, visited Sept. 2005)
[7] B. Davison. Recognizing Nepotistic Links on the Web. In AAAI-2000 Workshop on Artificial Intelligence for Web Search, July 2000.
[8] D. Fetterly, M. Manasse and M. Najork. Spam, Damn Spam, and Statistics: Using statistical analysis to locate spam web pages. In 7th International Workshop on the Web and Databases, June 2004.
[9] D. Fetterly, M. Manasse and M. Najork. Detecting Phrase-Level Duplication on the World Wide Web. In 28th Annual International ACM SIGIR Conference on Research and Development in Information Retrieval, Aug. 2005.
[10] Y. Freund and R. E. Schapire. A decision-theoretic generalization of on-line learning and an application to boosting. In European Conference on Computational Learning Theory, 1995.
[11] Z. Gyöngyi, H. Garcia-Molina and J. Pedersen. Combating Web Spam with TrustRank. In 30th International Conference on Very Large Data Bases, Aug. 2004.
[12] Z. Gyöngyi and H. Garcia-Molina. Link Spam Alliances. In 31st International Conference on Very Large Data Bases, Aug. 2005.
[13] Z. Gyöngyi and H. Garcia-Molina. Web Spam Taxonomy. In 1st International Workshop on Adversarial Information Retrieval on the Web, May 2005.
[14] GZIP. http://www.gzip.org
[15] M. Henzinger, R. Motwani and C. Silverstein. Challenges in Web Search Engines. SIGIR Forum 36(2), 2002.
[16] J. Hidalgo. Evaluating cost-sensitive Unsolicited Bulk Email categorization. In 2002 ACM Symposium on Applied Computing, Mar. 2002.
[17] B. Jansen and A. Spink. An Analysis of Web Documents Retrieved and Viewed. In International Conference on Internet Computing, June 2003.
[18] C. Johnson. US eCommerce: 2005 To 2010. http://www.forrester.com/Research/Document/Excerpt/0,7211,37626,00.html (dated Sept. 2005, visited Sept. 2005)
[19] C. Manning and H. Schütze. Foundations of Statistical Natural Language Processing. The MIT Press, 1999, Cambridge, Massachusetts.
[20] P. Metaxas and J. DeStefano. Web Spam, Propaganda and Trust. In 1st International Workshop on Adversarial Information Retrieval on the Web, May 2005.
[21] G. Mishne, D. Carmel and R. Lempel. Blocking Blog Spam with Language Model Disagreement. In 1st International Workshop on Adversarial Information Retrieval on the Web, May 2005.
[22] MSN Search. http://search.msn.com/
[23] J. Nielsen. Statistics for Traffic Referred by Search Engines and Navigation Directories to Useit. http://useit.com/about/searchreferrals.html (dated April 2004, visited Sept. 2005)
[24] L. Page, S. Brin, R. Motwani and T. Winograd. The PageRank Citation Ranking: Bringing Order to the Web. Stanford Digital Library Technologies Project, 1998.
[25] A. Perkins. The Classification of Search Engine Spam. http://www.silverdisc.co.uk/articles/spam-classification/ (dated Sept. 2001, visited Sept. 2005)
[26] J. R. Quinlan. C4.5: Programs for Machine Learning. Morgan-Kaufman, 1993.
[27] J. R. Quinlan. Bagging, Boosting, and C4.5. In 13th National Co class="data"nference on Artificial Intelligence and 8th Innovative Applications of Artificial Intelligence Conference, Vol. 1, 725-730, Aug. 1996.
[28] M. Sahami, S. Dumais, D. Heckerman and E. Horvitz. A Bayesian Approach to Filtering Junk E-Mail. In Learning for Text Categorization: Papers from the 1998 Workshop, AAAI Technical Report WS-98-05, 1998.
[29] B. Wu and B. Davison. Identifying Link Farm Spam Pages. In 14th International World Wide Web Conference, May 2005.
[30] B. Wu and B. Davison. Cloaking and Redirection: a preliminary study. In 1st International Workshop on Adversarial Information Retrieval on the Web, May 2005.
[31] H. Zhang, A. Goel, R. Govindan, K. Mason and B. Van Roy. Making Eigenvector-Based Systems Robust to Collusion. In 3rd International Workshop on Algorithms and Models for the Web Graph, Oct. 2004.